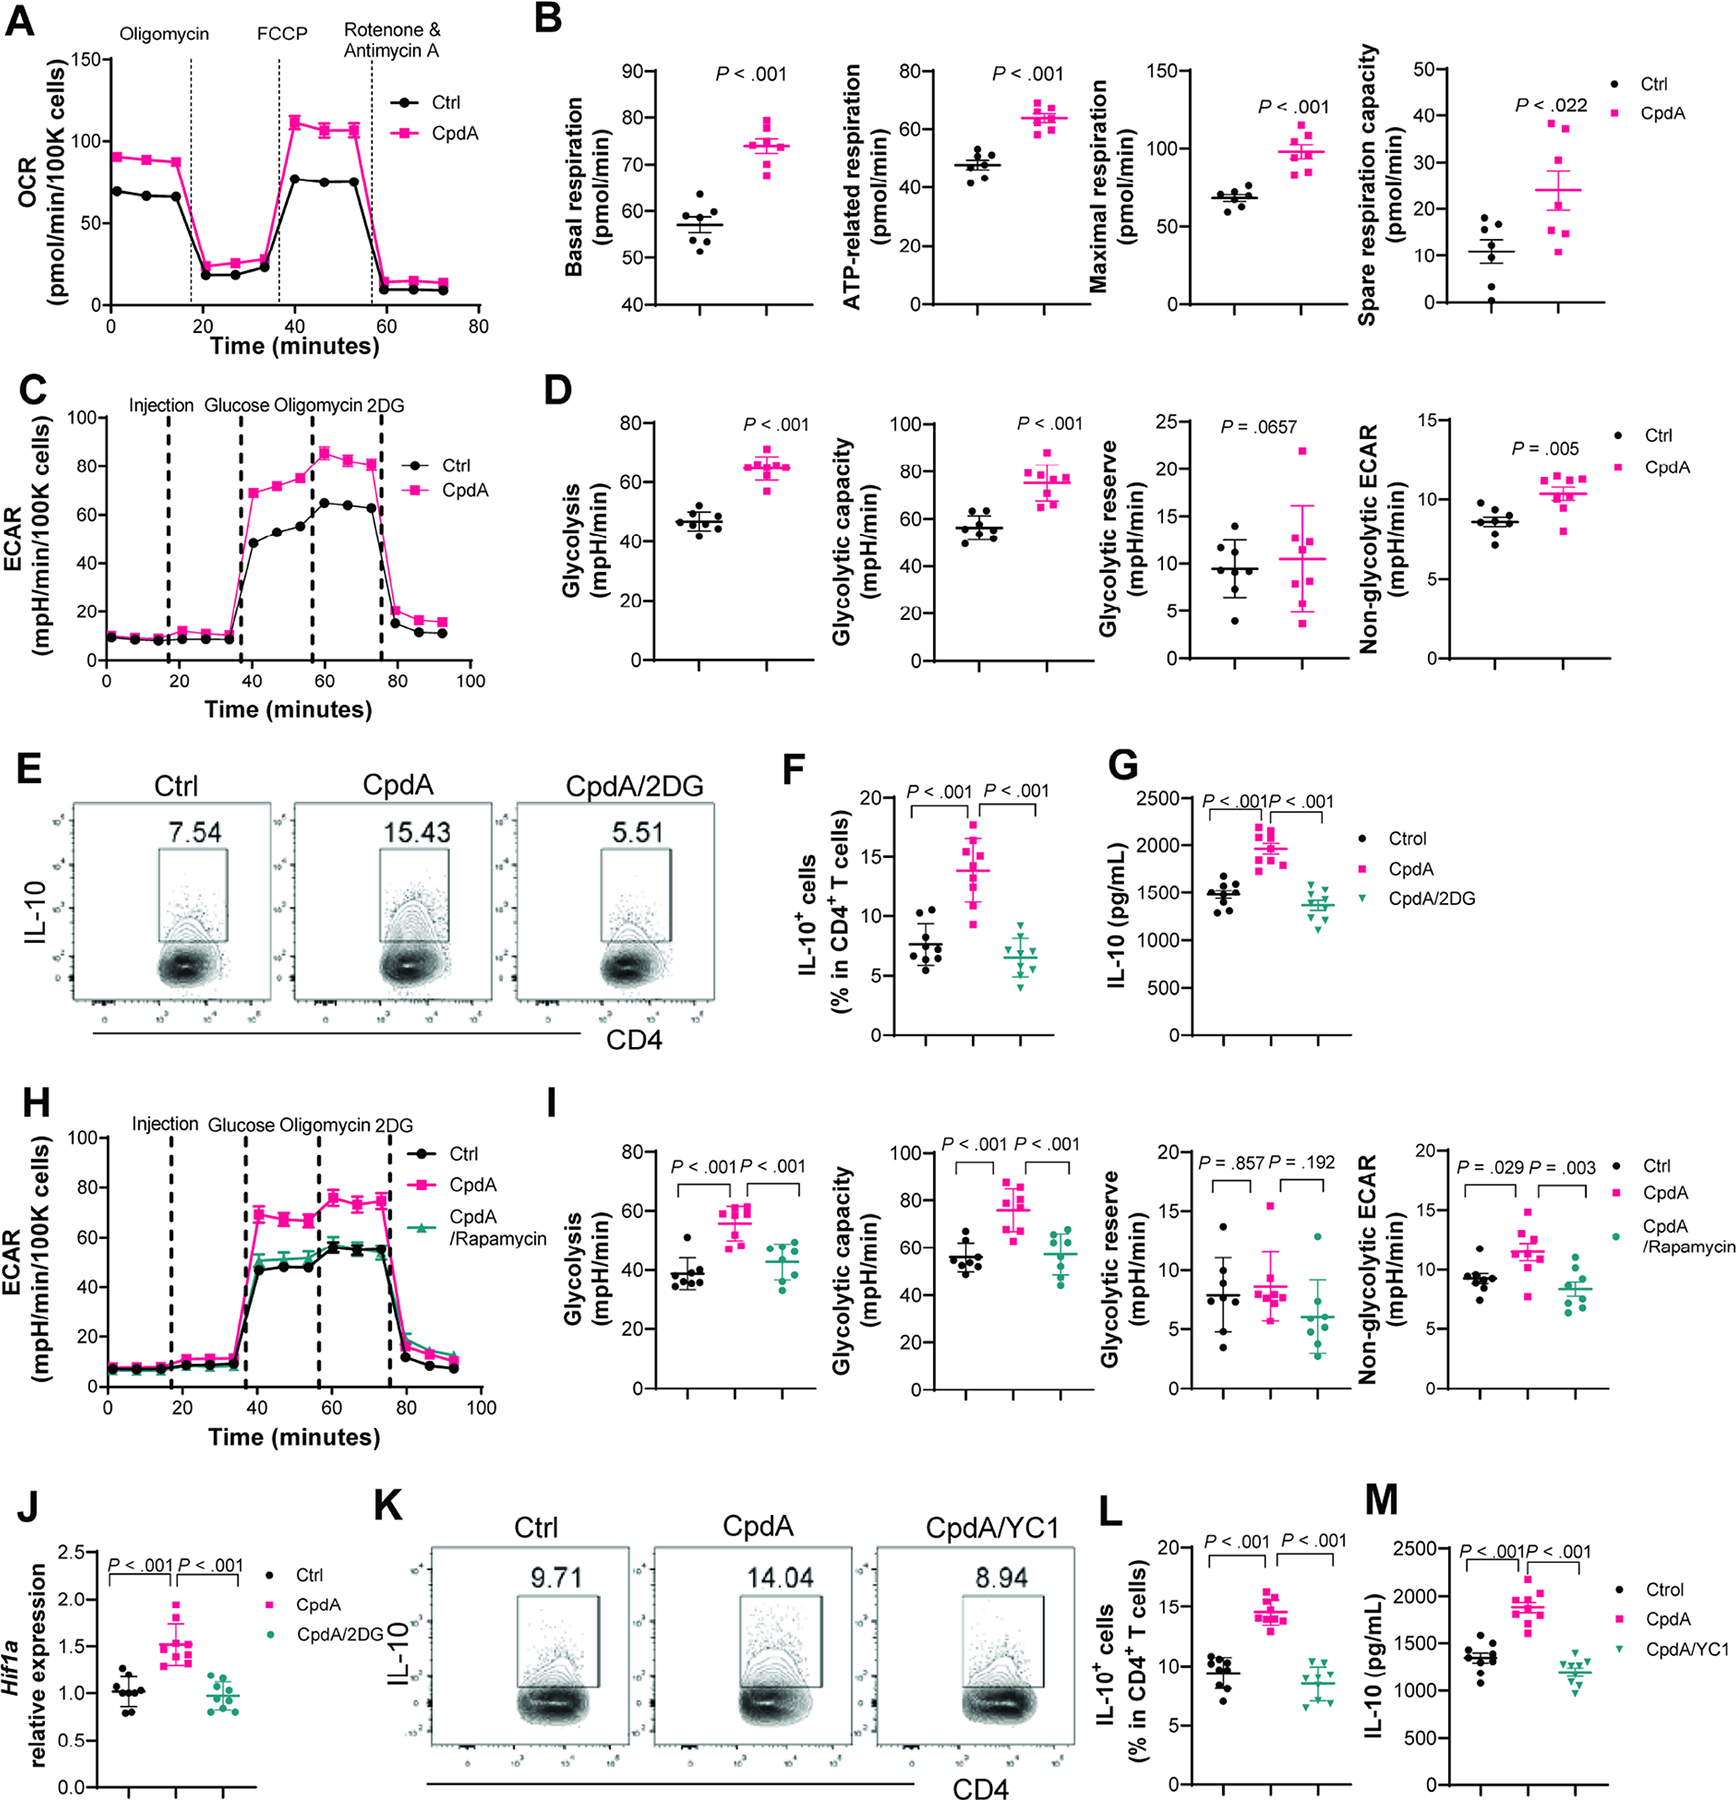
Fig. 5. GPR120 agonist promotes IL-10 production through the glycolysis-HIF1α pathway.

(A–B) Splenic CD4+T cells were activated with anti-CD3/anti-CD28±CpdA under Th1 conditions for 48 hours, and the Mito stress test kit was used to measure the parameters of mitochondrial respiration (N=7/group). The OCR profile, basal respiration, ATP-related respiration, maximum respiration, and spare respiration capacity. (C–D, and H–I) Splenic CD4+T cells were activated with anti-CD3/anti-CD28 under Th1 conditions for 48 hours, and a Glycolytic stress test kit was used to measure the key parameters of glycolysis (N=8/group). The ECAR profile, glycolysis, glycolytic capacity, glycolytic reserve, and non-glycolytic ECAR. (E–G) CD4+T cells were treated with or without CpdA±2-DG (N=9/group). IL-10+CD4+T cells on day 5 (E–F), and IL-10 in culture supernatants on day 2 (G). (J) Hif1a mRNA expression in CD4+T cells treated with or without CpdA±2-DG at 48 hours (N=9/group). (K–M) CD4+T cells were treated with or without CpdA±YC-1 (N=9/group). Flow cytometry profile of IL-10+CD4+T cells at day 5 (K–L) and IL-10 production in culture supernatants on day 2 (M). (E–G, and J-M) Data are pooled from three independent experiments. (B and D) Unpaired Student’s t-test (F, G, I, L, and M) one-way ANOVA.
