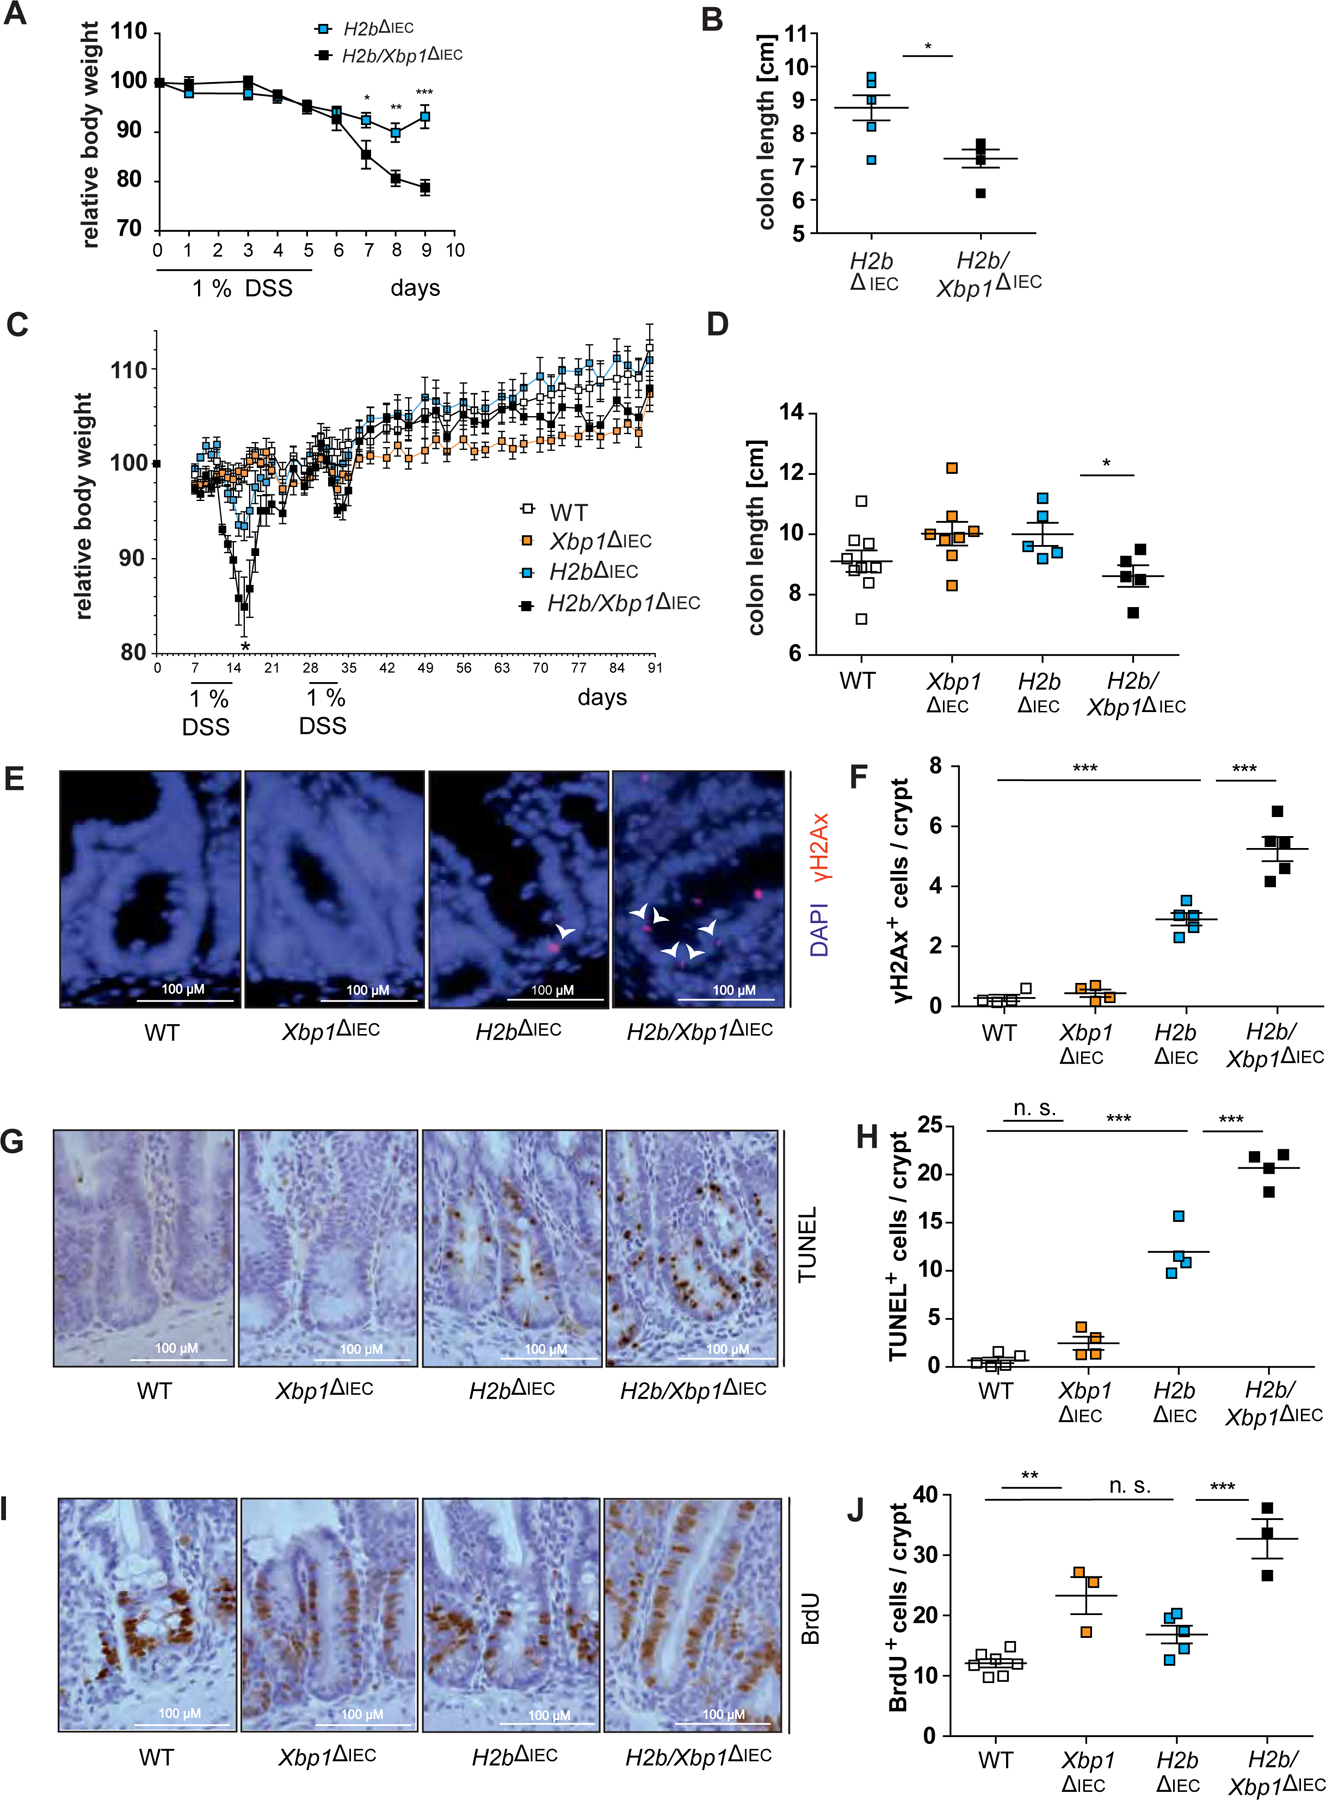
Figure 4: Deletion of Xbp1 heightens susceptibility towards DSS-induced colitis.

(A) Weight curve and (B) colon length from acute DSS-induced colitis with age-matched H2b∆IEC (n = 6, 1 female, 5 males) and H2b/Xbp1∆IEC (n = 6, 3 females, 3 males) animals. (C) Weight curve and (D) colon length from chronic DSS-induced colitis with age-matched WT (n = 9, 5 females, 4 males), Xbp1∆IEC (n = 8, 4 females, 4 males), H2b∆IEC (n = 5, 2 females, 3 males) and H2b/Xbp1∆IEC (n = 5, 4 females, 1 male) mice. Representative images of the SI for (E) γH2Ax, with white arrowheads indicating γH2Ax+-nuclei, (G) TUNEL and (I) BrdU and the accompanying statistical analyses of (F), γH2Ax+, (H) TUNEL+ and (J) BrdU+ cells in the respective genotypes. Data are expressed as mean ± standard error of the mean and significance was determined using unpaired Student’s t-test (A-D) or one-way ANOVA (E-J). * p < .05, ** p < .01, *** p < .0001.
