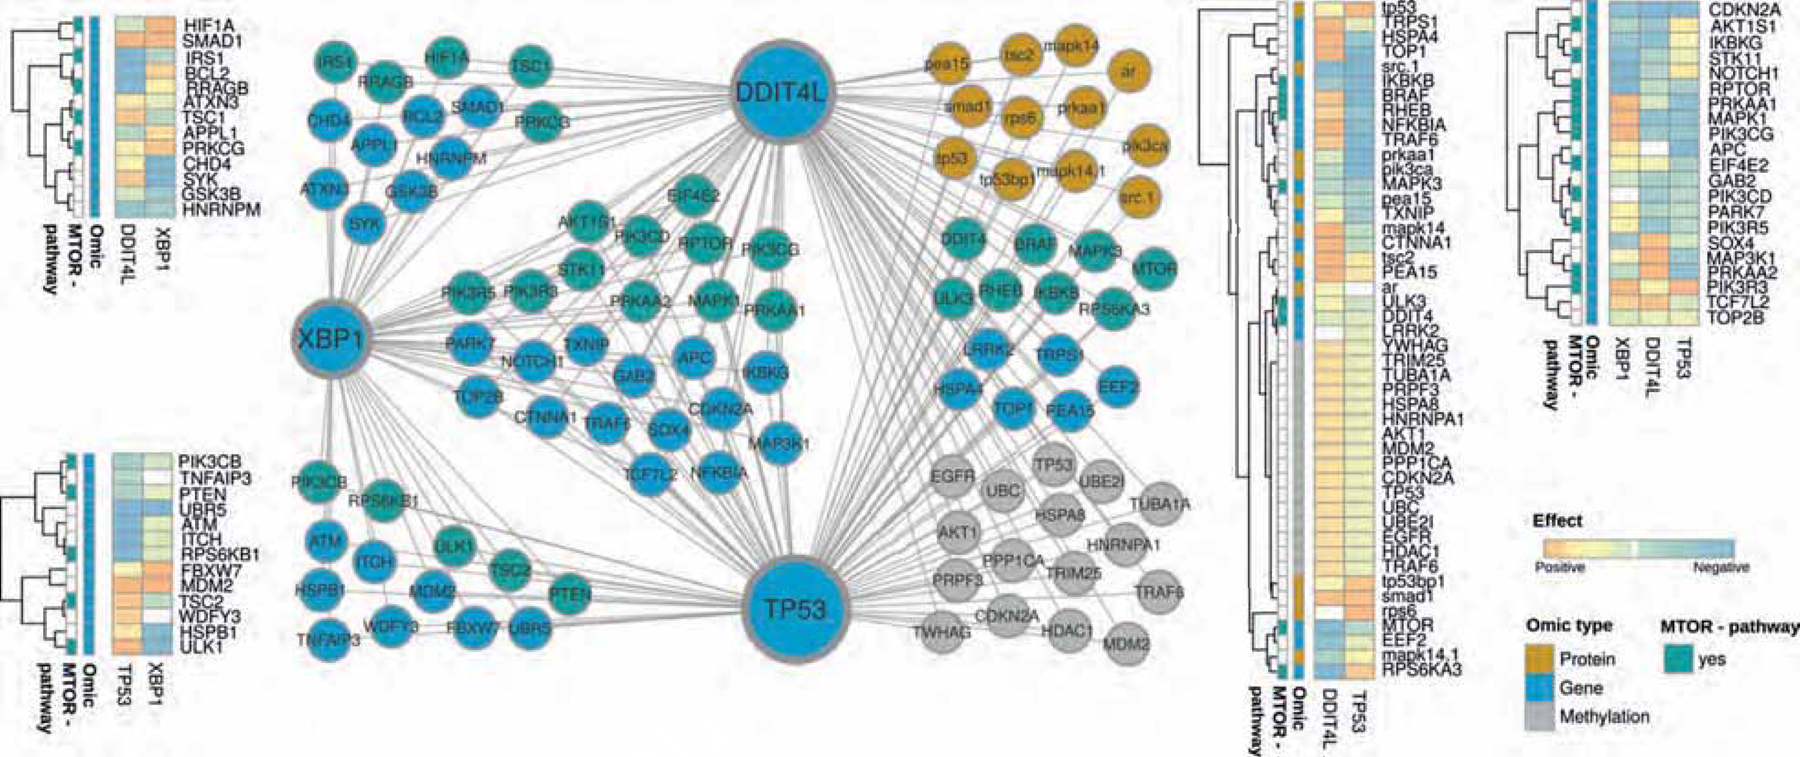
Figure 6: Inferred multi-omic network based on TCGA colorectal cancer subset using KiMONo algorithm.

Within the network, nodes represent methylation sites (grey), proteins (orange) and genes (blue & turquoise). Connections between the nodes denote statistical identified effects obtained via KiMONo. The heatmaps on the side visualize the positive (orange) and negative (blue) effect strength between an omic feature, XBP1, TP53 and DDIT4L.
