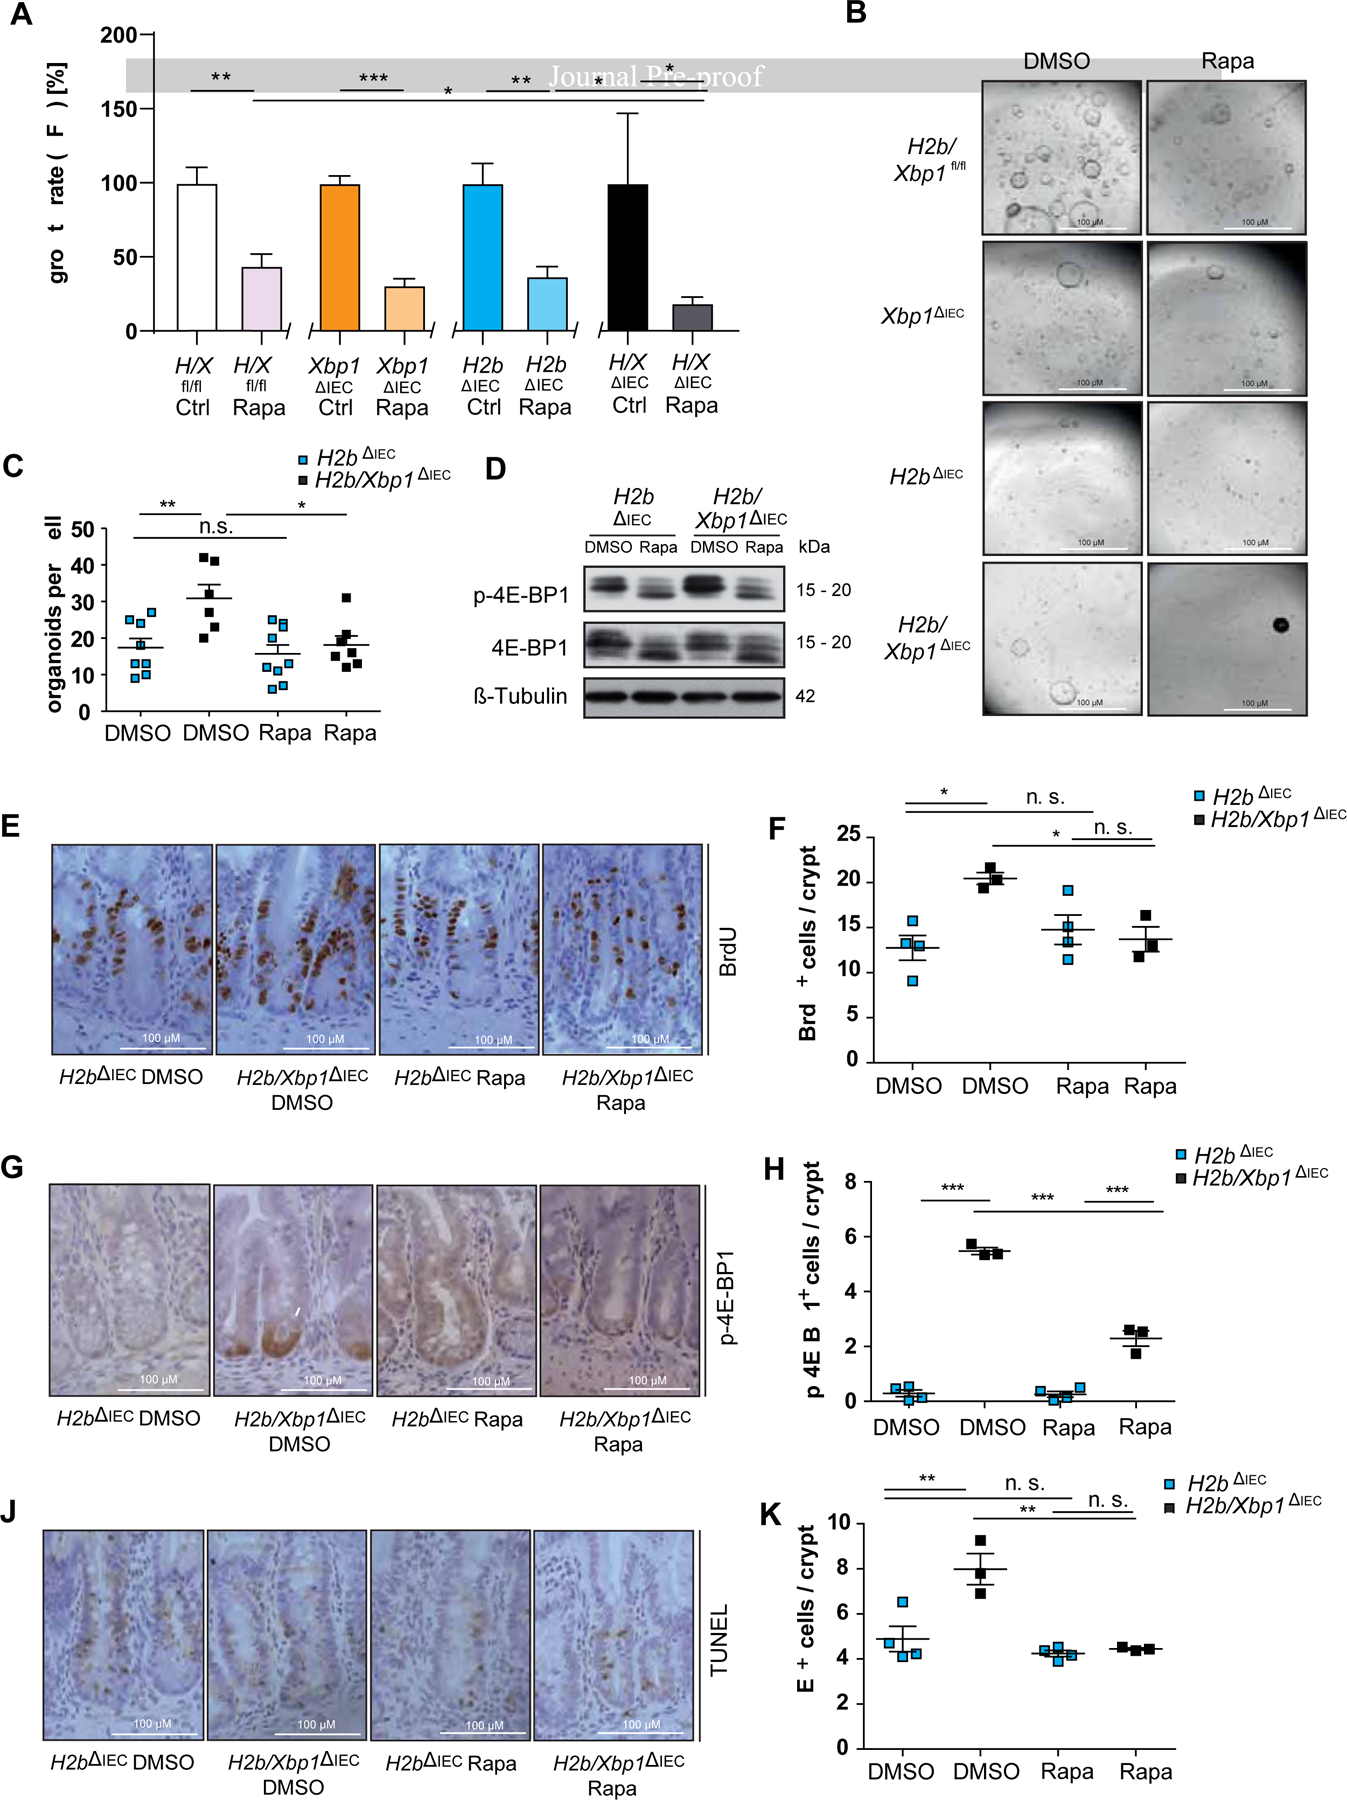
Figure 7: Rapamycin abolishes DDIT4L-mediated hyperproliferation by inhibiting mTOR-dependent phosphorylation of 4E-BP1.

(A) CellTiter-Glo assay and representative images (B) of small intestinal organoids stimulated with either DMSO (control) or 1 μM Rapamycin for 72 hours. Representative data of n = 3 individual experiments with n = 3 technical replicates. H2b/Xbp1fl/fl/ΔIEC organoids are abbreviated as “H/Xfl/fl/ΔIEC”. (C) colony formation assay of H2bΔIEC and H2b/Xbp1ΔIEC intestinal organoids, treated with DMSO or 1 μM Rapamycin every other day over the time course of 10 days, representative of n = 3 experiments with n = 3 technical replicates. (D) Western blot of H2bΔIEC and H2b/Xbp1ΔIEC intestinal organoids, treated with DMSO or 1 μM Rapamycin for 24 hours, representative of n = 3 experiments. β-Tubulin served as a loading control. Data are expressed as mean ± standard error of the mean and significance was determined using an unpaired Student’s t-test. Age-matched H2b∆IEC (n = 8, 5 females, 3 males) and H2b/Xbp1∆IEC (n = 6, 2 females, 4 males) mice received either DMSO or 1.5 mg / kg body weight Rapamycin i.p. daily for 7 days. Representative images of the SI of DMSO- vs. Rapamycin-treated H2b∆IEC and H2b/Xbp1∆IEC mice for (E) BrdU, (G) p-4E-BP1 and (I) TUNEL and accompanying statistical analysis (F) BrdU+, (H), p-4E-BP1+ and (J) TUNEL+ cells. Data are expressed as mean ± standard error of the mean and significance was determined using one-way ANOVA. * p < .05, ** p < .01, *** p < .0001.
