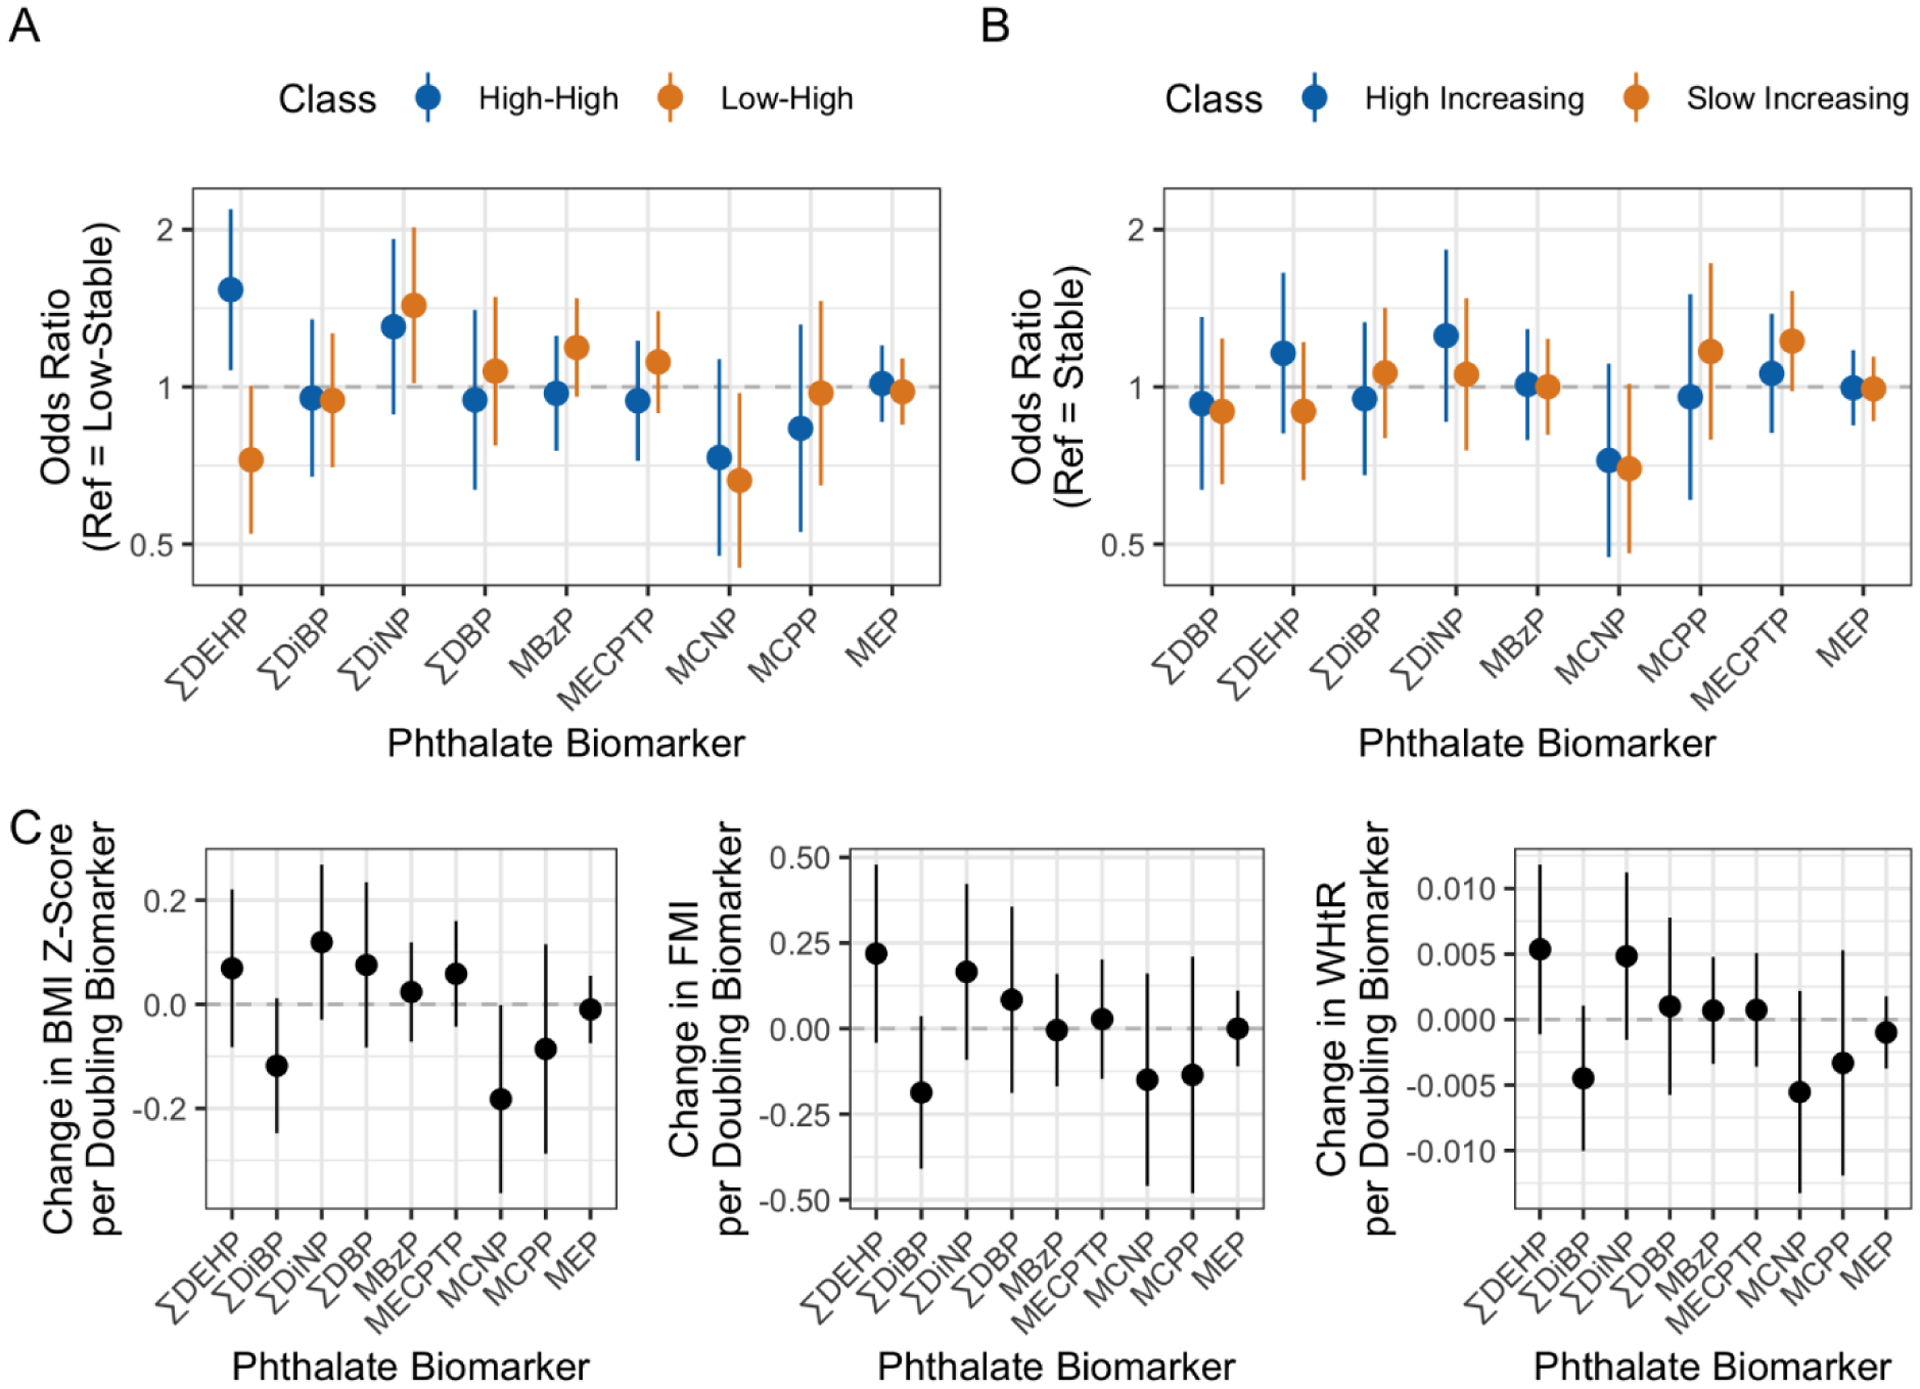
Figure 2.

Associations of 2nd and 3rd trimester geometric mean urinary phthalate metabolites with A) non-centered adiposity trajectory classes, B) centered adiposity trajectory classes, and C) overall BMI z-score, fat mass index (FMI) and WHtR (waist-to-height ratio), using multinomial logistic regression with the “low-stable” and “stable” classes as the reference groups (A and B, respectively), or linear mixed-effects models (C). Logistic regression model estimates are presented as odds ratios per doubling of metabolite concentrations with 95% confidence intervals (CI’s). Colors represent the comparison classes (blue: “high-high” or “high-stable”; yellow: “low-high” or “high increasing”. Linear mixed-effects models are presented as the change in outcome per doubling of phthalate biomarker with 95% CI’s. All models included all 9 phthalate biomarkers and were adjusted for maternal age, maternal pre-pregnancy BMI, parity, socioeconomic status, education, child sex, and date and phthalate measurement. Mixed-effects models were additionally adjusted for linear and quadratic terms for child age at visit.
