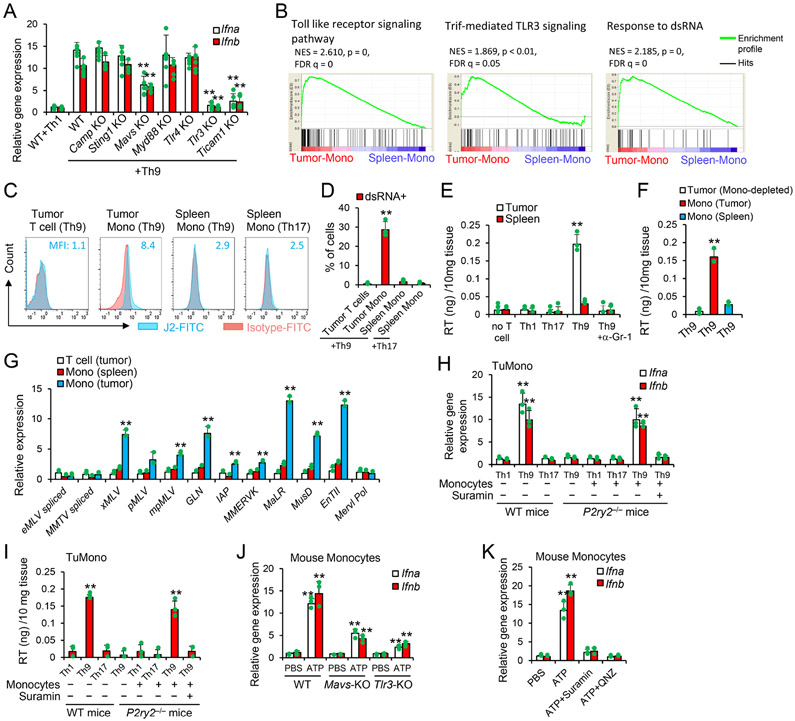
Figure 6. Viral mimicry in tumor monocytes is required for Th9 anti-ALV responses.
(A) B1610%TRP-1-KO tumor-bearing WT or transgenic mice were treated as shown in Fig. 1F. Tumor tissues (10 days after ACT) were extracted for total RNA and analyzed by qPCR (n=3/group), Data are mean ± SD. **P<0.01, compared with WT+Th9 group, one-way ANOVA with Tukey test. (B) GSEA of the gene profiles as in Fig. 5A was performed for the indicated gene signatures. (C-D) Intracellular staining of dsRNA (n=3/group) was performed in the indicated cells 10 days after treatments similar as in Fig. 1F. Data are mean ± SD. **P<0.01, compared with any other groups, one-way ANOVA with Tukey test. (E-F) B1610%TRP-1-KO tumor-bearing WT mice were treated as shown in Fig. 1F. Tumor tissues (E) or sorted cells (F) 10 days after ACT were lysed by 1% Triton-X-100. Data are mean ± SD. **P<0.01, compared with any other groups, one-way ANOVA with Tukey test. (G) Tumor-infiltrating cells sorted from Th9-treated mice 10 days after transfer (n=3/group) were tested for transcript levels of the indicated murine ERVs measured by qPCR. Data are mean ± SD. **P<0.01, compared with T cell (tumor) and Mono (spleen) groups, one-way ANOVA with Tukey test. (H-I) WT SpMono sorted from CTX-treated mice were injected into tumor of P2ry2−/− mice (10 days after tumor-bearing P2ry2−/− mice treated with CTX+T cells w/o suramin). The tumor tissues were analyzed by qPCR (H) and RT activity (I) 3 days later (n=3-4/group). Data are mean ± SD. **P<0.01, Th9 cells compared with Th1, Th17 cells, and spleen-mono injected into tumor receiving Th9 cells and suramin, one-way ANOVA with Tukey test. (J) SpMono sorted from CTX-treated WT, Tlr3 KO, or Mavs KO mice were treated as indicated and performed for qPCR analysis (n=3/group). Data are mean ± SD. **P<0.01, compared with PBS or WT/ATP groups, one-way ANOVA with Tukey test. (K) WT SpMono sorted from CTX-treated mice were treated as indicated and performed for qPCR (n=3/group). Data are mean ± SD. **P<0.01, compared with any other groups, one-way ANOVA with Tukey test. Representative results from one of two repeated experiments are shown.

