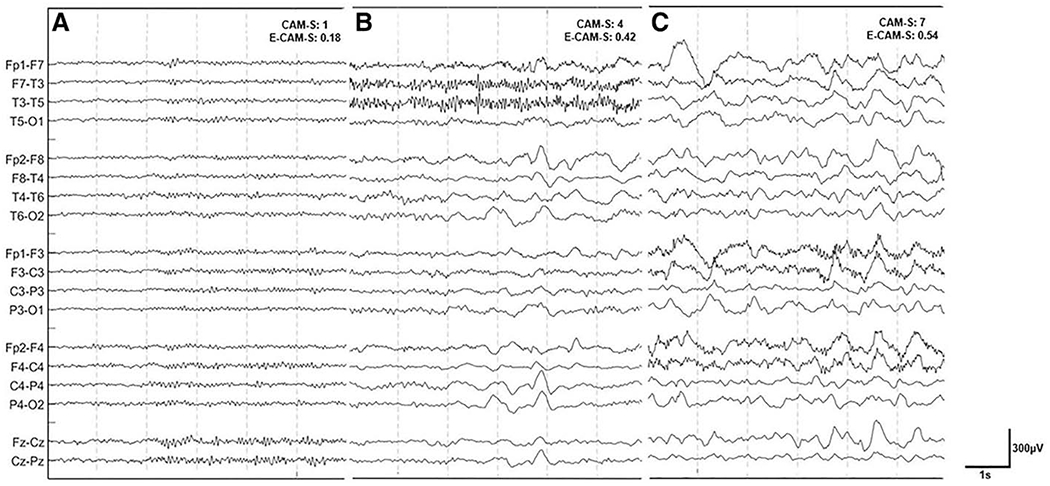
Figure 1.

Electroencephalography (EEG) patterns vs. delirium severity. Examples of three EEG recordings of patients with low (A), moderate (B), and high (C) Confusion Assessment Method Severity (CAM-S) scores, along with their corresponding Electroencephalography Confusion Assessment Method Severity (E-CAM-S) scores. EEGs were processed using a notch filter at 60 Hz and a bandpass filter from 0.5 to 30 Hz.
