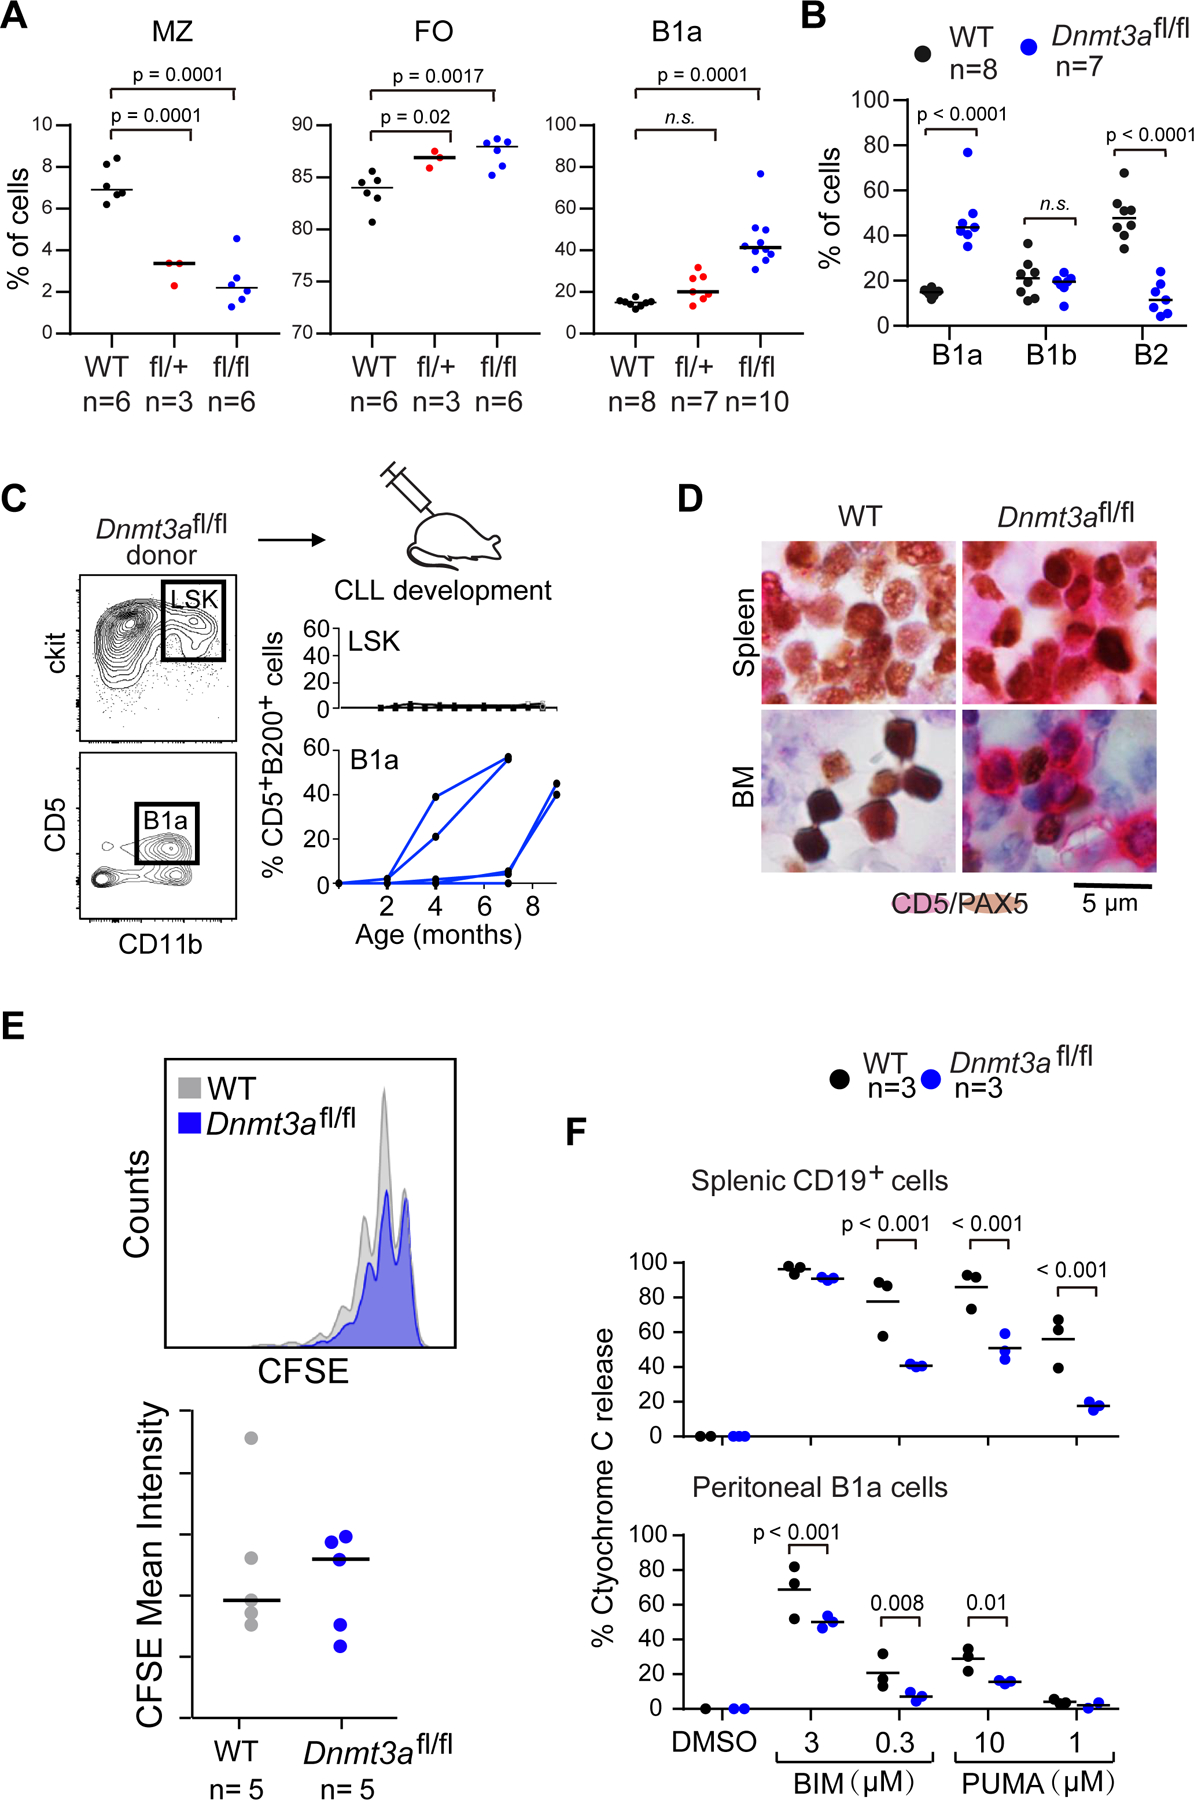
Figure 2: B1a cells expansion in the peritoneal cavity of Dnmt3afl/fl mice results in CLL development.

A, Analysis of the percentage of marginal zone B cells (MZ), follicular B cells (FO) from the total splenocytes suspension and the percentage of B1a from peritoneal B cells of WT, Dnmt3afl/fl mice. Data were compared using one way ANOVA followed by Dunnett multiple comparison test. B, Proportions of bone marrow B cell subpopulations. C, Transfer of Lin-;ScaI+;c-kit+ (LSK) or B1a cells from Dnmt3afl/fl or WT donor mice to CD45.1 recipient mice and flow cytometry analysis of B220+ CD5+ cells within peripheral blood over time (n=5). D, Representative immunohistochemical staining of CD5+(red) and PAX5+ (brown) of spleen and bone narrow (BM) sections from CD45.1 recipient mice following tranfer of B1a cells from WT and Dnmt3afl/fl CLL mice. E, B1a cells were isolated from WT and Dnmt3afl/fl mice, stained with CSFE and injected intraperitoneally into CD45.1 recipient mice. B1a cells were analyzed for CFSE intensity by flow cytometry 11 days post injection. F, BH3 profiles of peritoneal B1a cells and splenic CD19+ cells.
