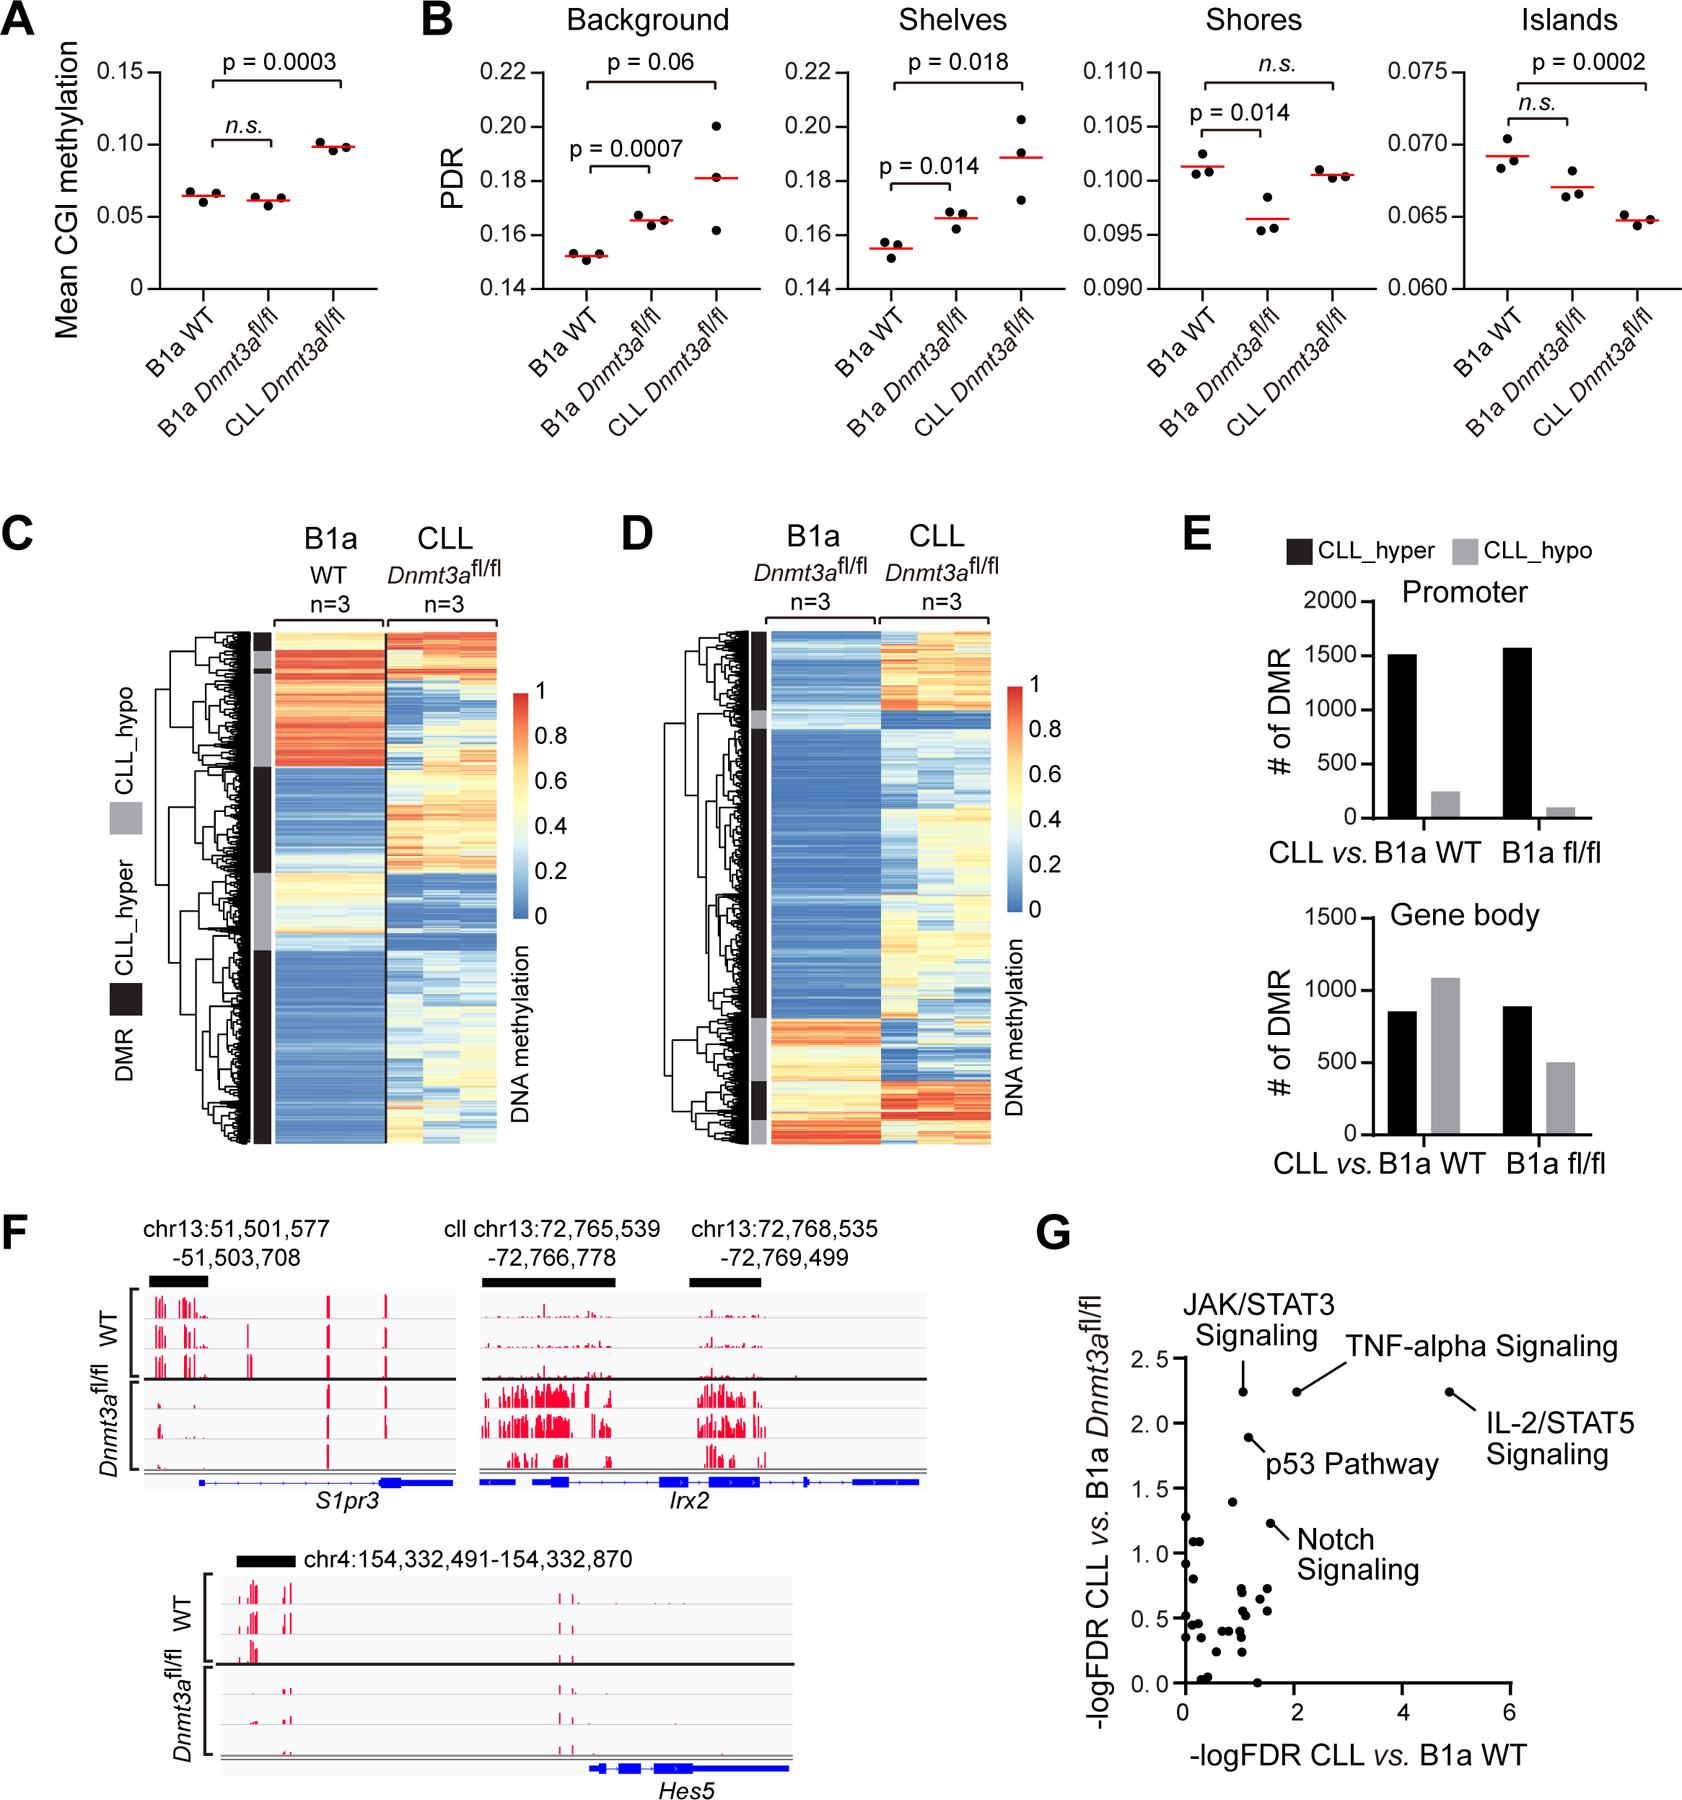
Figure 4: Changes in methylome and transcriptome associated with Dnmt3a-depleted CLL cells.

A, Mean CGI methylation in WT and Dnmt3afl/fl B1a or CLL cells (n=3). B, PDR associated with different DNA regions in different cells. CpG islands (CGIs) were downloaded from the UCSC genome browser (defined as regions > 500 bp, > 55% GC and expected/observed CpG ratio of >0.65), CGI shores +/−2Kb from islands, CpG shelves +−2Kb from CGI shores. (n=3) C, Heatmap of DMRs between Dnmt3afl/fl CLL cells and WT B1a. D, Heatmap of DMRs between Dnmt3afl/fl B1a and Dnmt3afl/fl CLL cells (n=3 each). E, Number of DMRs in Dnmt3afl/fl CLLs versus Dnmt3afl/fl or WT B1a cells associated with promoter regions or gene body. F, Examples of DMRs in Dnmt3afl/fl CLL cells versus WT B1a cells. G, Signaling pathways enriched for differentially expressed genes between Dnmt3afl/fl CLL cells versus WT B1a cells, as well as between Dnmt3afl/fl CLL cells versus Dnmt3afl/fl B1a cells.
