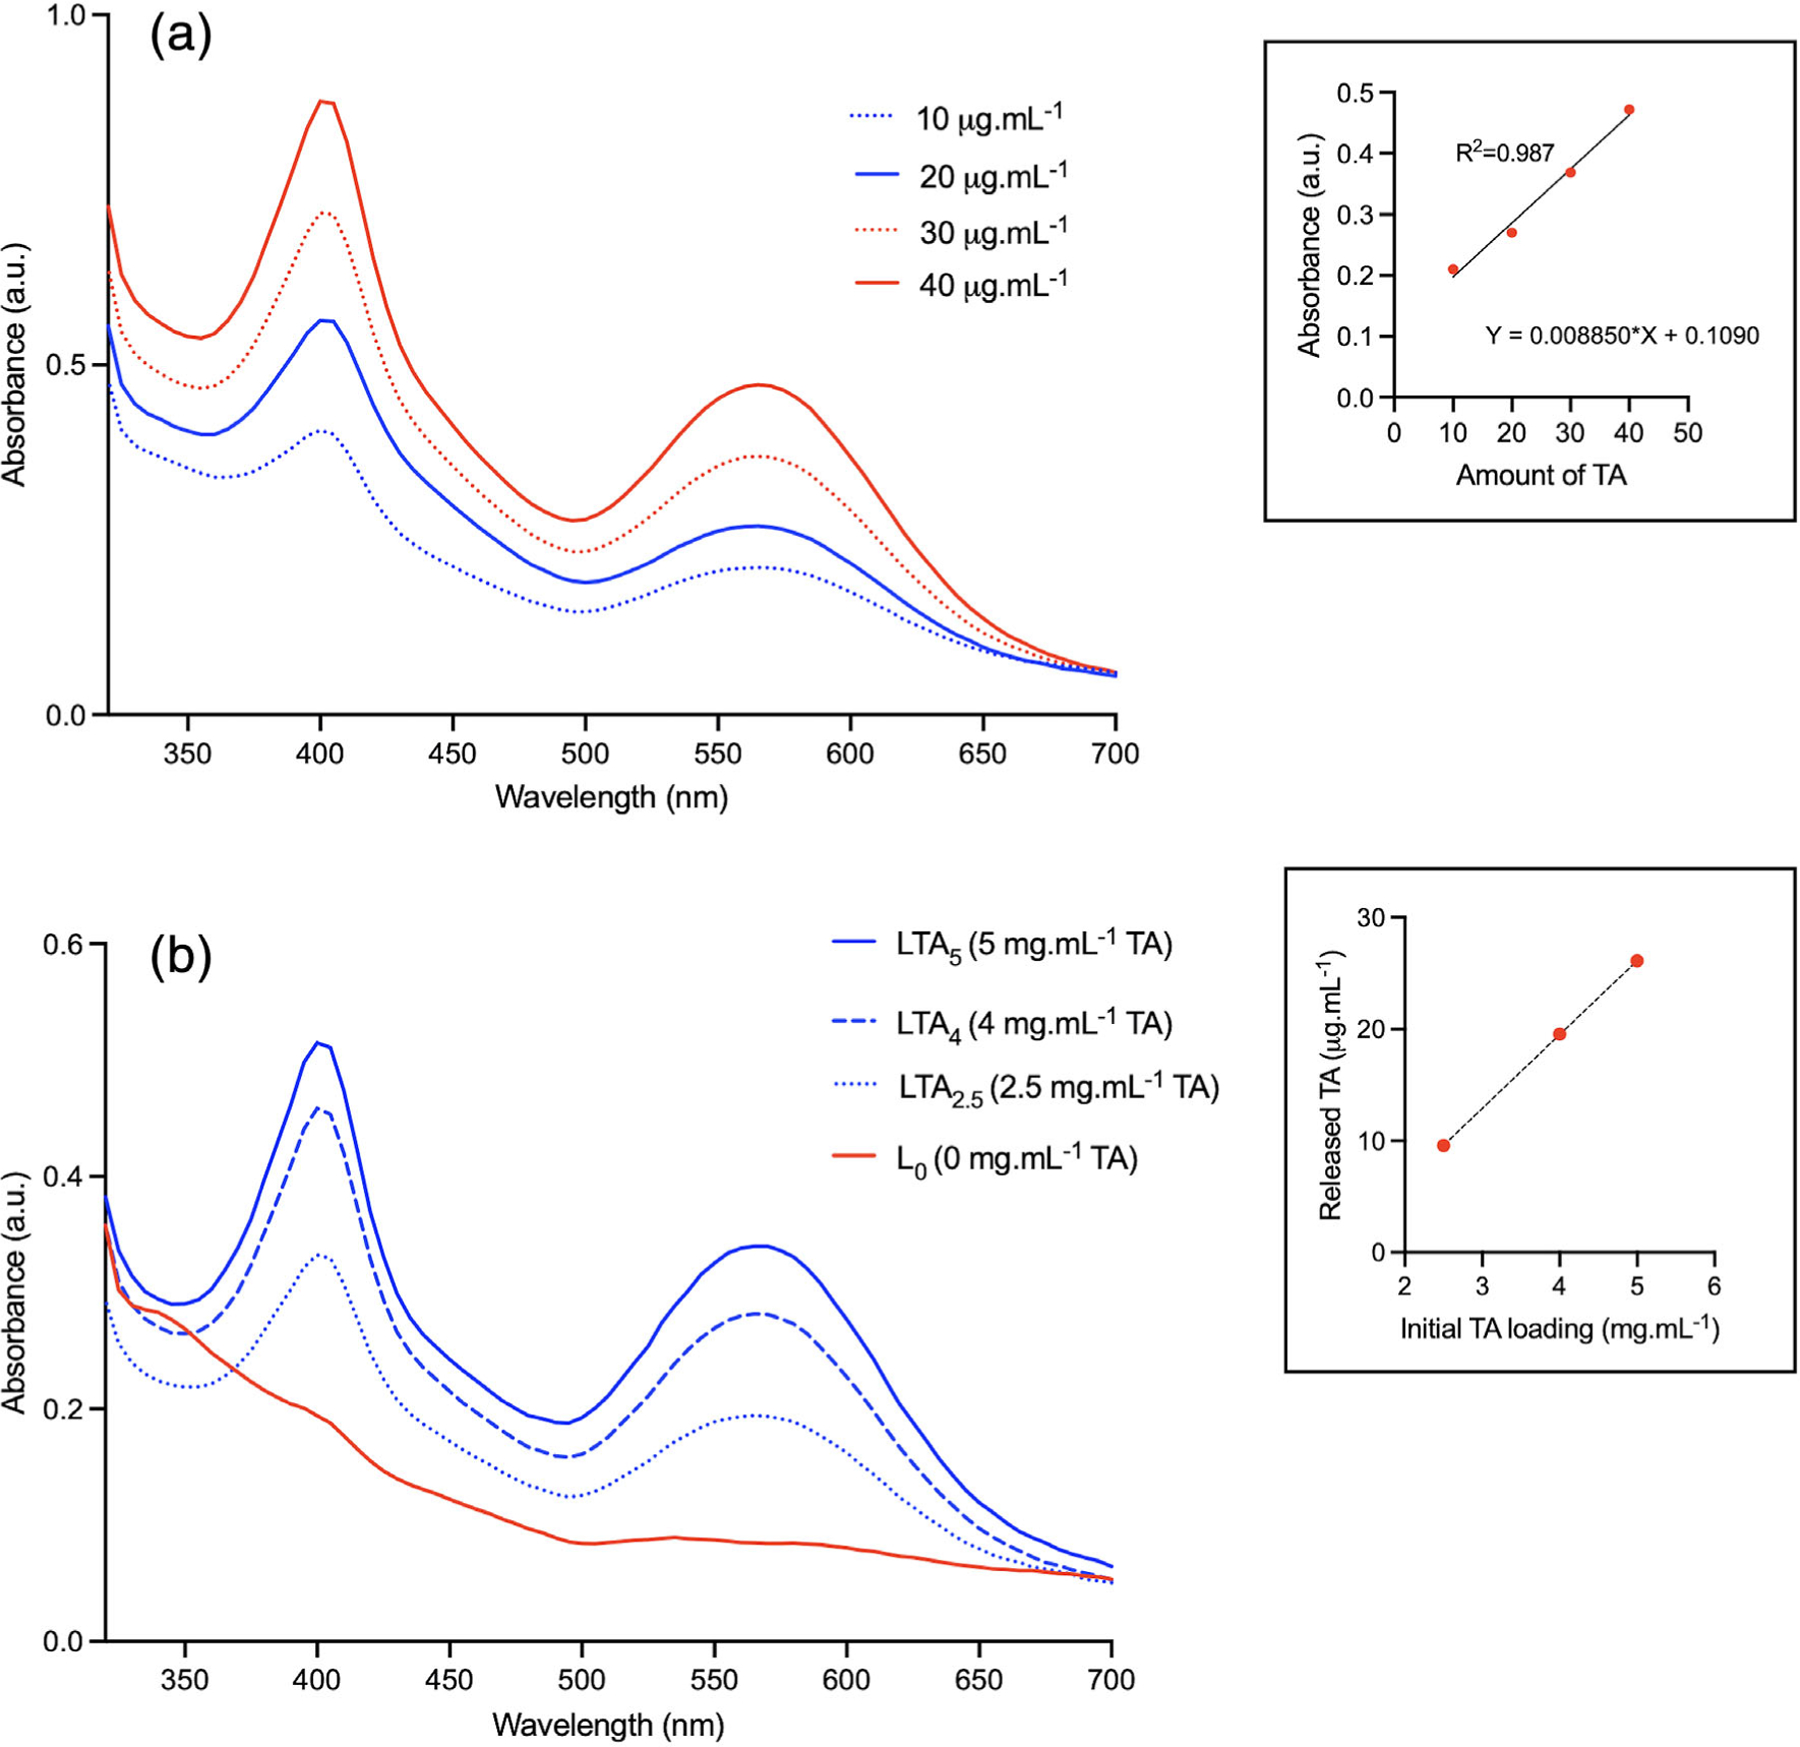
FIGURE 5.

Ultraviolet–visible (UV–vis) spectra. (a) Calibration curve for tranexamic acid; inset: linear regression. (b) UV–vis spectra for the various compositions; inset: regression for LTA2.5, LTA4, and LTA5

Ultraviolet–visible (UV–vis) spectra. (a) Calibration curve for tranexamic acid; inset: linear regression. (b) UV–vis spectra for the various compositions; inset: regression for LTA2.5, LTA4, and LTA5