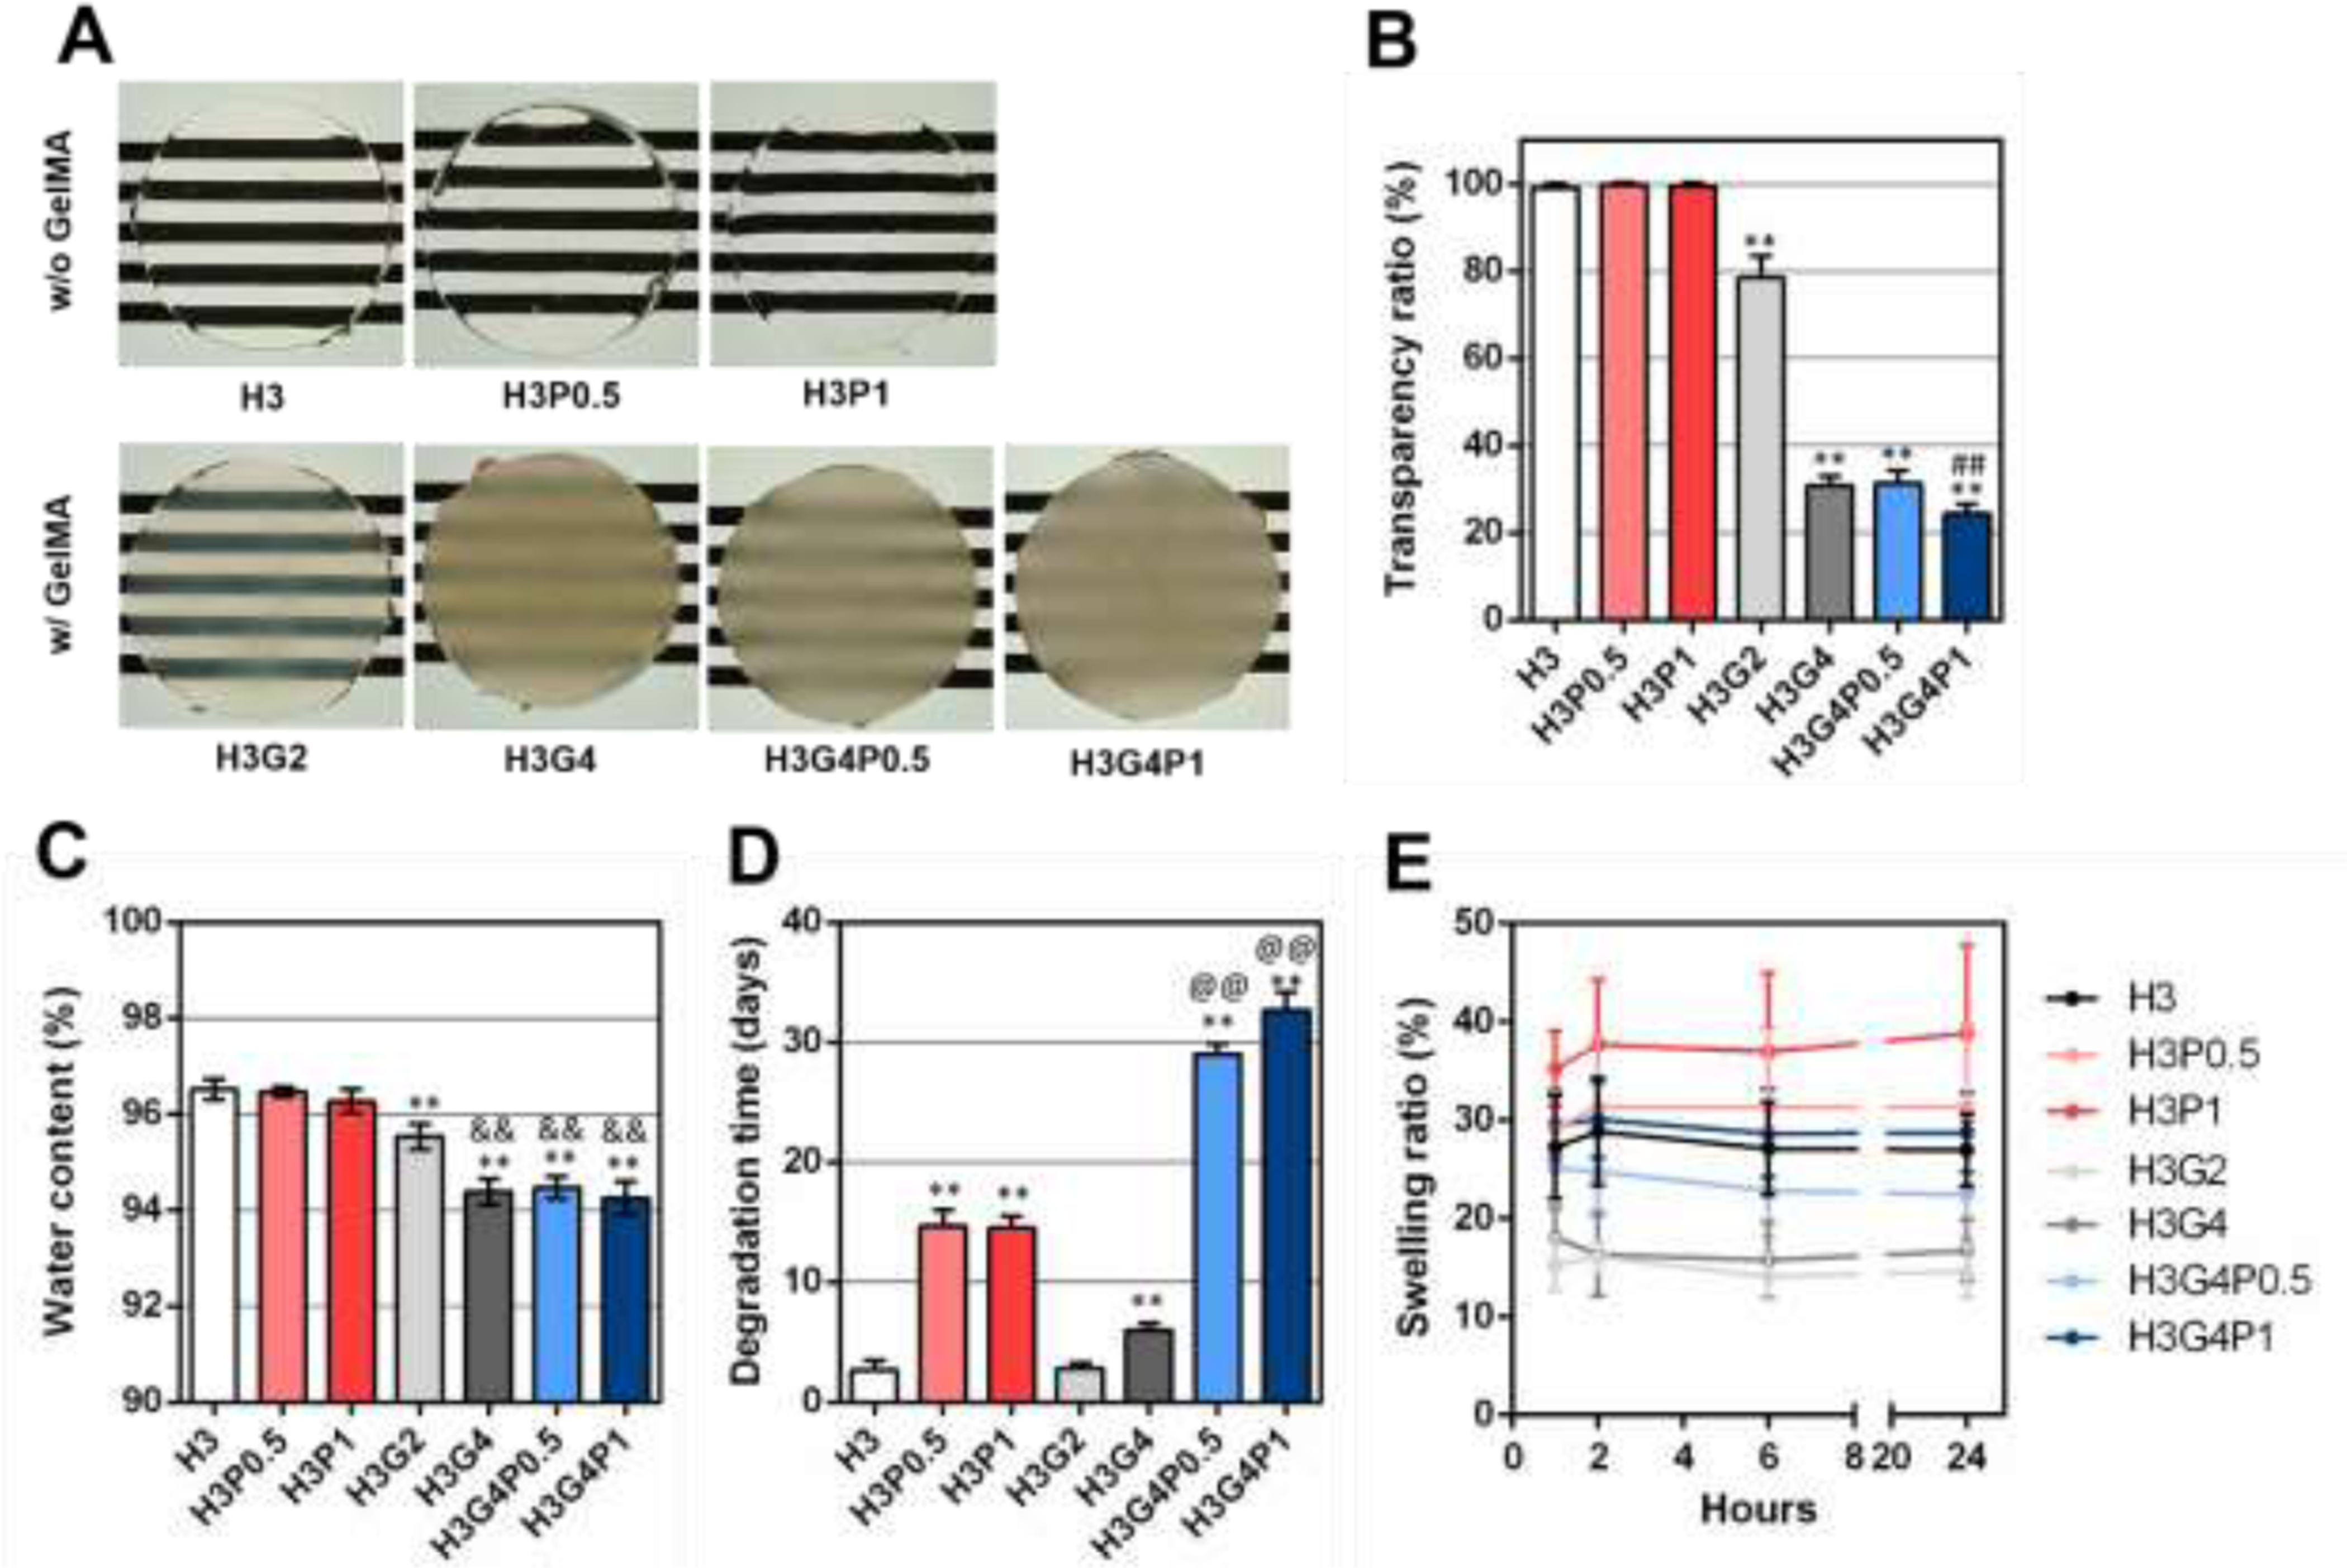
Figure 3. Physical characterization of hydrogels after photocrosslinking.

(A) Macroscopic images of photocrosslinked hydrogel sample, prepared with 3% HAGM and different concentrations of GelMA and PEGDA, placed on a resolution test chart. (B) Transparency ratios (%), (C) water content (%), (D) degradation time (days) and (E) swelling ratio over 24 h after photocrosslinking (%) of the photocrosslinked hydrogels. Data is represented as mean ± SD (**p<0.005 compared to H3, ##p<0.005 compared to H3G4P0.5, &&p<0.005 compared to H3G2, @@p<0.005 compared to H3P1, n=6).
