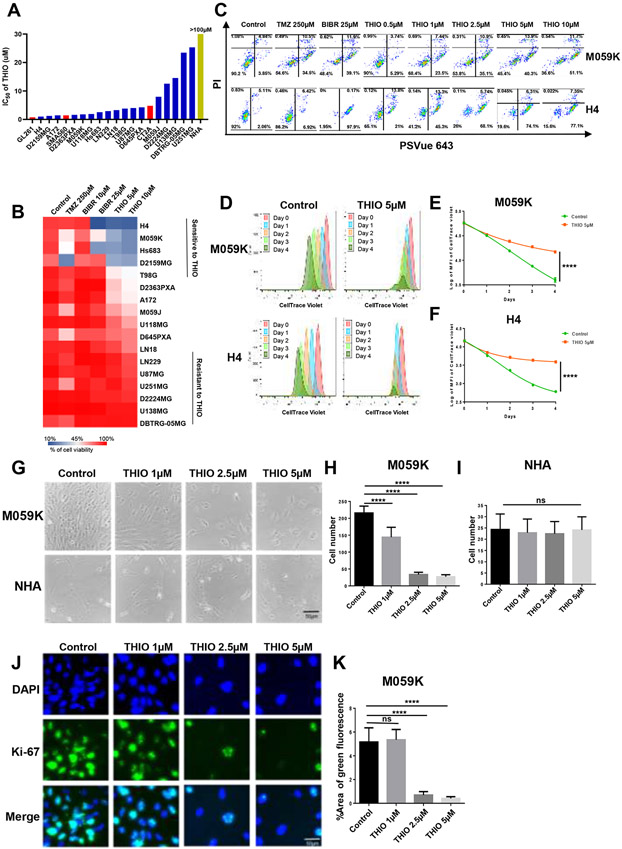
Figure 1.
Short-term treatment of glioma cell lines with THIO. (A) IC50 of THIO for 17 human glioma cell lines, 3 mouse glioma cell lines and normal human astrocyte (NHA). Cells were treated with THIO for 4 days at titrated doses ranging from 0.01 μM to 100 μM. And then CCK-8 assay was used to determine the cell viability. Graphpad Prism software was used to calculate IC50 of THIO. (B) Heatmap of cell viability for 17 glioma cell lines following treatment with the control, TMZ, BIBR1532 and THIO for 4 days at titrated doses. Cells were treated with TMZ, BIBR 1532 and THIO for 4 days and then stained with PI and PSVue 643 to distinguish live cells from apoptotic or dead cells by FACS (% of cell viability). (C) FACS data of M059K and H4. Cells were treated with THIO for 4 days at titrated doses and stained with PI and PSVue 643, and then analyzed by FACS. (D) M059K and H4 cells were labeled with CellTrace Violet and then treated with THIO at 5μM. The fluorescence intensity of CellTrace Violet was measured by FACS from Day 0 to Day 4. (E-F) The quantification of fluorescence intensity of CellTrace Violet in samples included in (D). (G) Phase contrast images of M059K and NHA cells treated with THIO at 0, 1, 2.5 and 5 μM for 4 days. (H-I) The quantification of cell number of M059K and NHA included in (G). Two experiments were ran and 9 fields for each group were measured. (J) Immunofluorescence staining images of M059K cells treated with or without THIO at 5μM for 4 days. Blue indicated the DAPI staining whereas green indicated the Ki-67 staining. (K) The quantification of the percentage of area with positive green fluorescence for samples shown in (J). Two experiments were ran and 9 fields for each group were measured.

