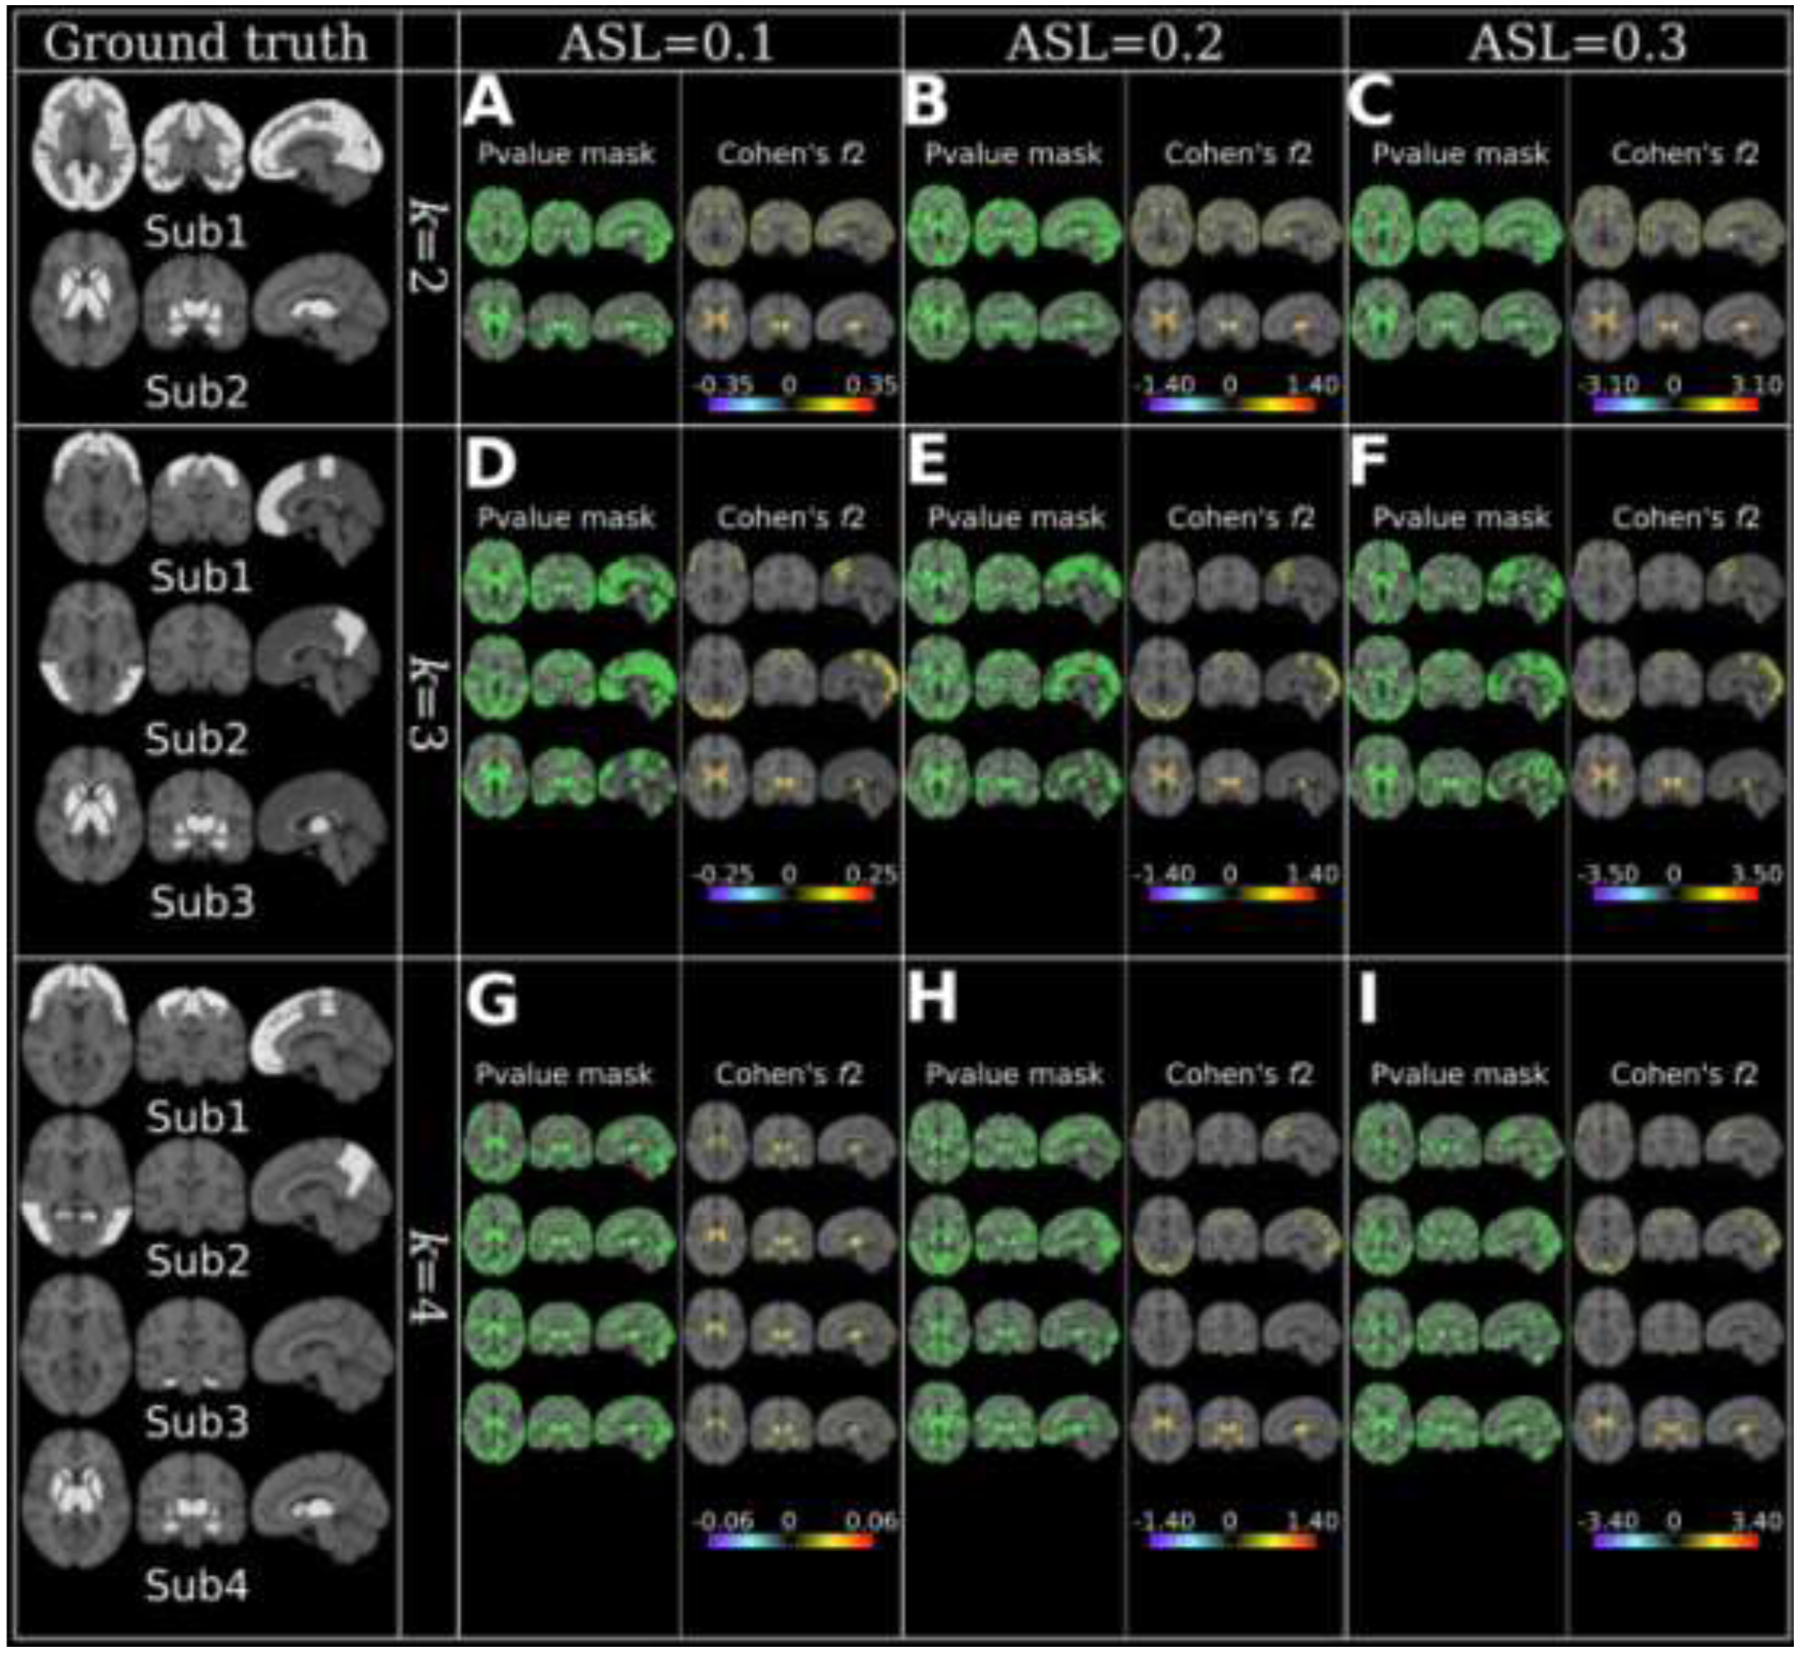
Figure 3.

MAGIC finds the ground truth of subtype’s neuroanatomical patterns when the clustering conditions are favorable, i.e., higher ASL or lower k. Neuroanatomical patterns are displayed using effect size maps based on voxel-wise group comparisons between CN and subtypes. Positive values denote brain atrophy (CN > Sub), while negative values correspond to larger brain volume in subtypes (CN < Sub). The ground truth of the subtypes pattern is presented with a binary mask (white) for each k in the first column. Moreover, we proposed a simulation accuracy metric (ACC): the proportion of the number of voxels that passed the statistical significance in the P-value mask maps over the number of voxels in the ground truth mask that was masked by the population-based RAVENS GM tissue mask. A) k=2 & ASL=0.1, Sub1: ACC=0.77, Sub2: ACC=0.81; B) k=2 & ASL=0.2, Sub1: ACC=0.78, Sub2: ACC=0.84; C) k=2 & ASL=0.3, Sub1: ACC=0.78, Sub2: ACC=0.89; D) k=3 & ASL=0.1, Sub1: ACC=0.67, Sub2: ACC=0.70, Sub3: ACC=0.82; E) k=3 & ASL=0.2, Sub1: ACC=0.73, Sub2: ACC=0.74, Sub3: ACC=0.87; F) k=3 & ASL=0.3, Sub1: ACC=0.76, Sub2: ACC=0.72, Sub3: ACC=0.89; G) k=4 & ASL=0.1, Sub1: ACC=0.55, Sub2: ACC=0.54, Sub3: ACC=0.66, Sub4: ACC=0.59; H) k=4 & ASL=0.2, Sub1: ACC=0.66, Sub2: ACC=0.64, Sub3: ACC=0.65, Sub4: ACC=0.77; I) k=4 & ASL=0.3, Sub1: ACC=0.63, Sub2: ACC=0.66, Sub3: ACC=0.64, Sub4: ACC=0.79. For reference, Cohen’s f2 ≥ 0.02, ≥ 0.15, and ≥ 0.35 represent small, medium, and large effect sizes, respectively.
