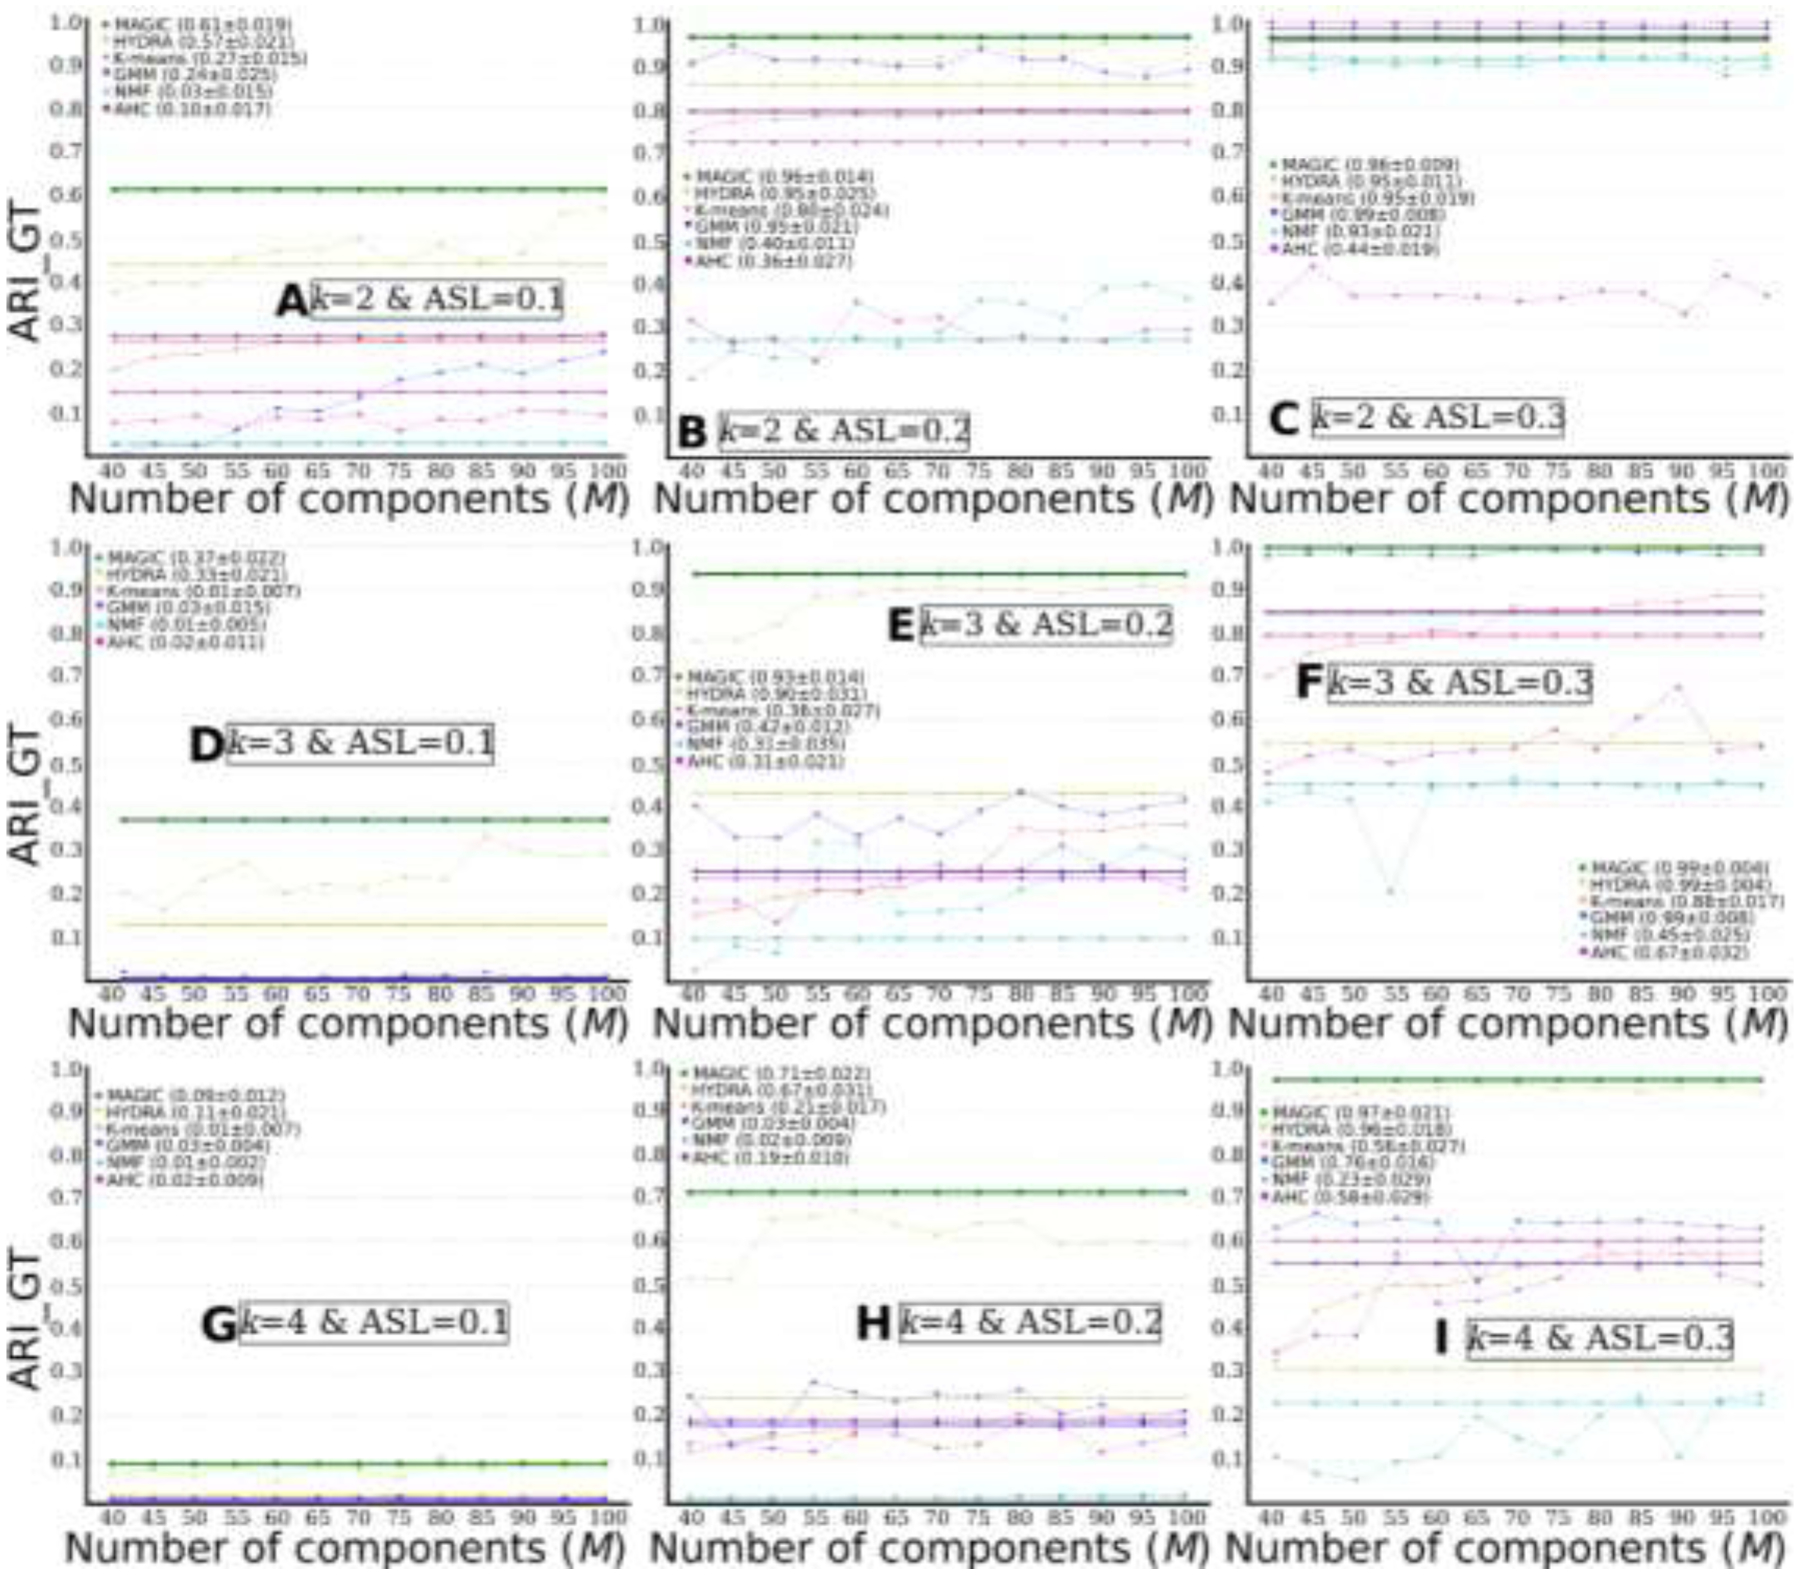
Figure 4.

MAGIC outperforms other common clustering methods. Comparisons of clustering performance between different methods: MAGIC, HYDRA, K-means, GMM, NMF, and agglomerative hierarchical clustering (AHC) (M=40 to 100 with a step as 5). The solid straight lines show clustering results for models that take multi-scale features as input and are drawn over all Ms only for visualization purposes. The dotted curve lines represent clustering results for models that take single-scale features as input. A) k=2 & ASL=0.1; B) k=2 & ASL=0.2; C) k=2 & ASL=0.3; D) k=3 & ASL=0.1; E) k=3 & ASL=0.2; F) k=3 & ASL=0.3; G) k=4 & ASL=0.1; H) k=4 & ASL=0.2; I) k=4 & ASL=0.3. We report the final consensus clustering performance (ARI_GT) for all models, together with the standard deviation of the 100-repetition clustering results during CV. For models using single-scale features, we show the results with the single-scale obtaining the highest ARI_GT.
