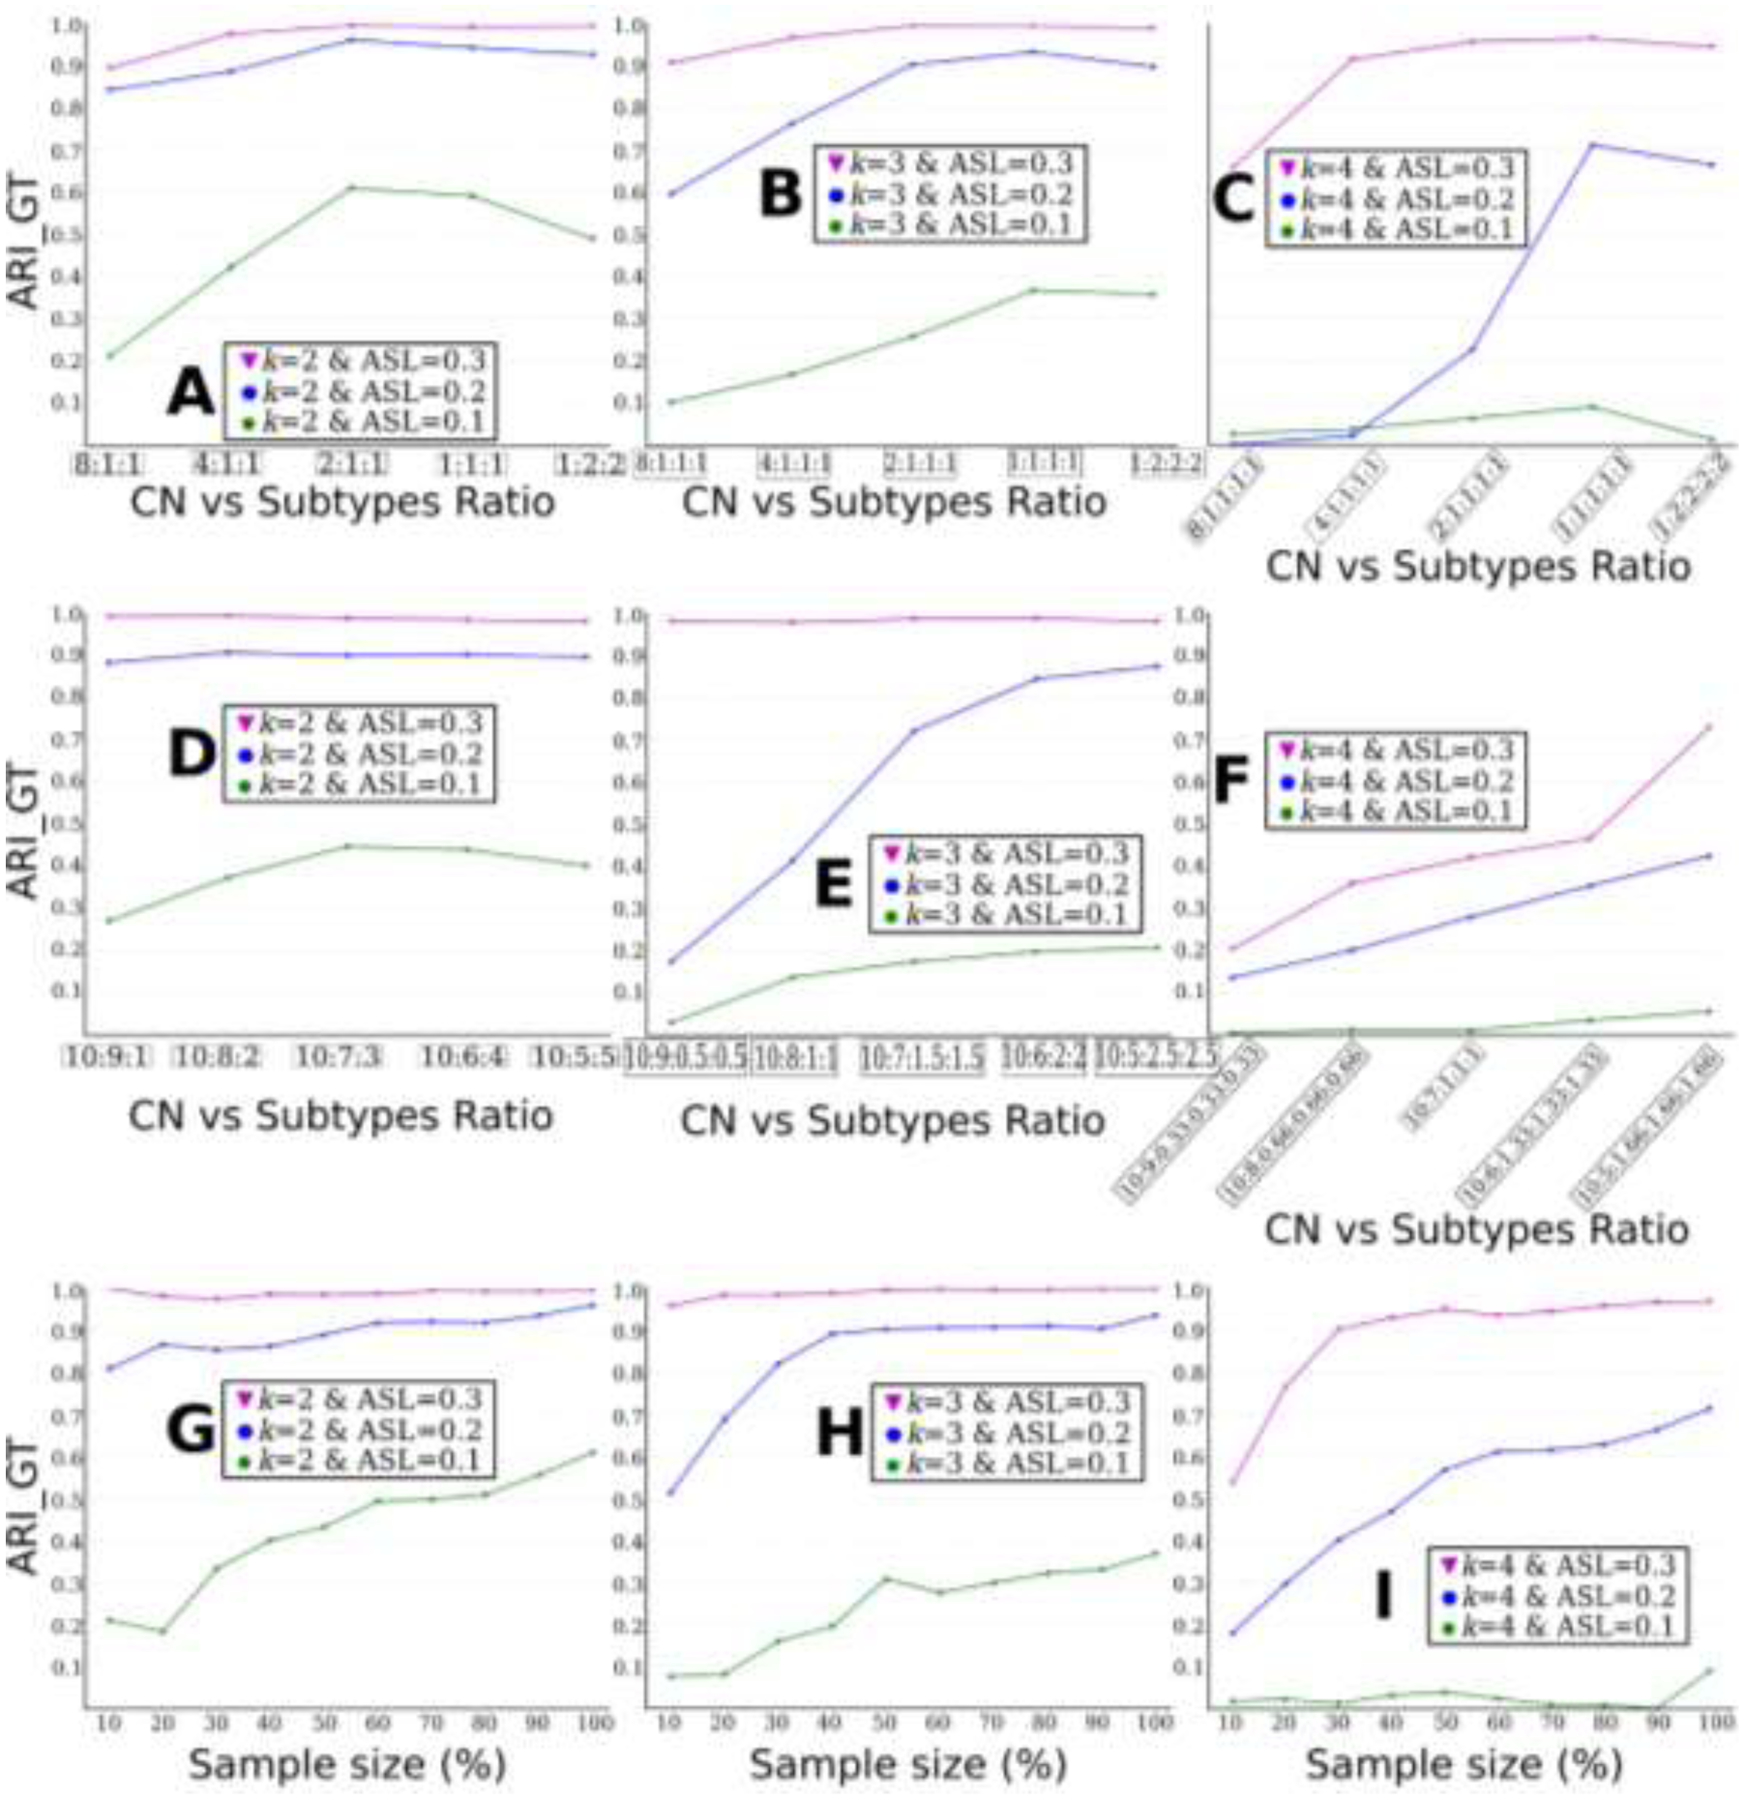
Figure 6.

The influence of different ratios of imbalanced data between CN vs. subtypes is presented in Fig. A, B, and C, among subtypes in Fig. D, E and F. The influence of sample size is displayed in Fig. G, H, and I. A) influence of data imbalance between CN and subtypes for k=2; B) influence of data imbalance between CN and subtypes for k=3; C) influence of data imbalance between CN and subtypes for k=4; D) influence of data imbalance among subtypes for k=2. Clustering performance improves with the increase of the sample size. E) influence of data imbalance among subtypes for k=3; F) influence of data imbalance among subtypes for k=4; G) influence of sample sizes for k=2; H) influence of sample sizes for k=3; I) influence of sample sizes for k=4.
