
Figure 1.
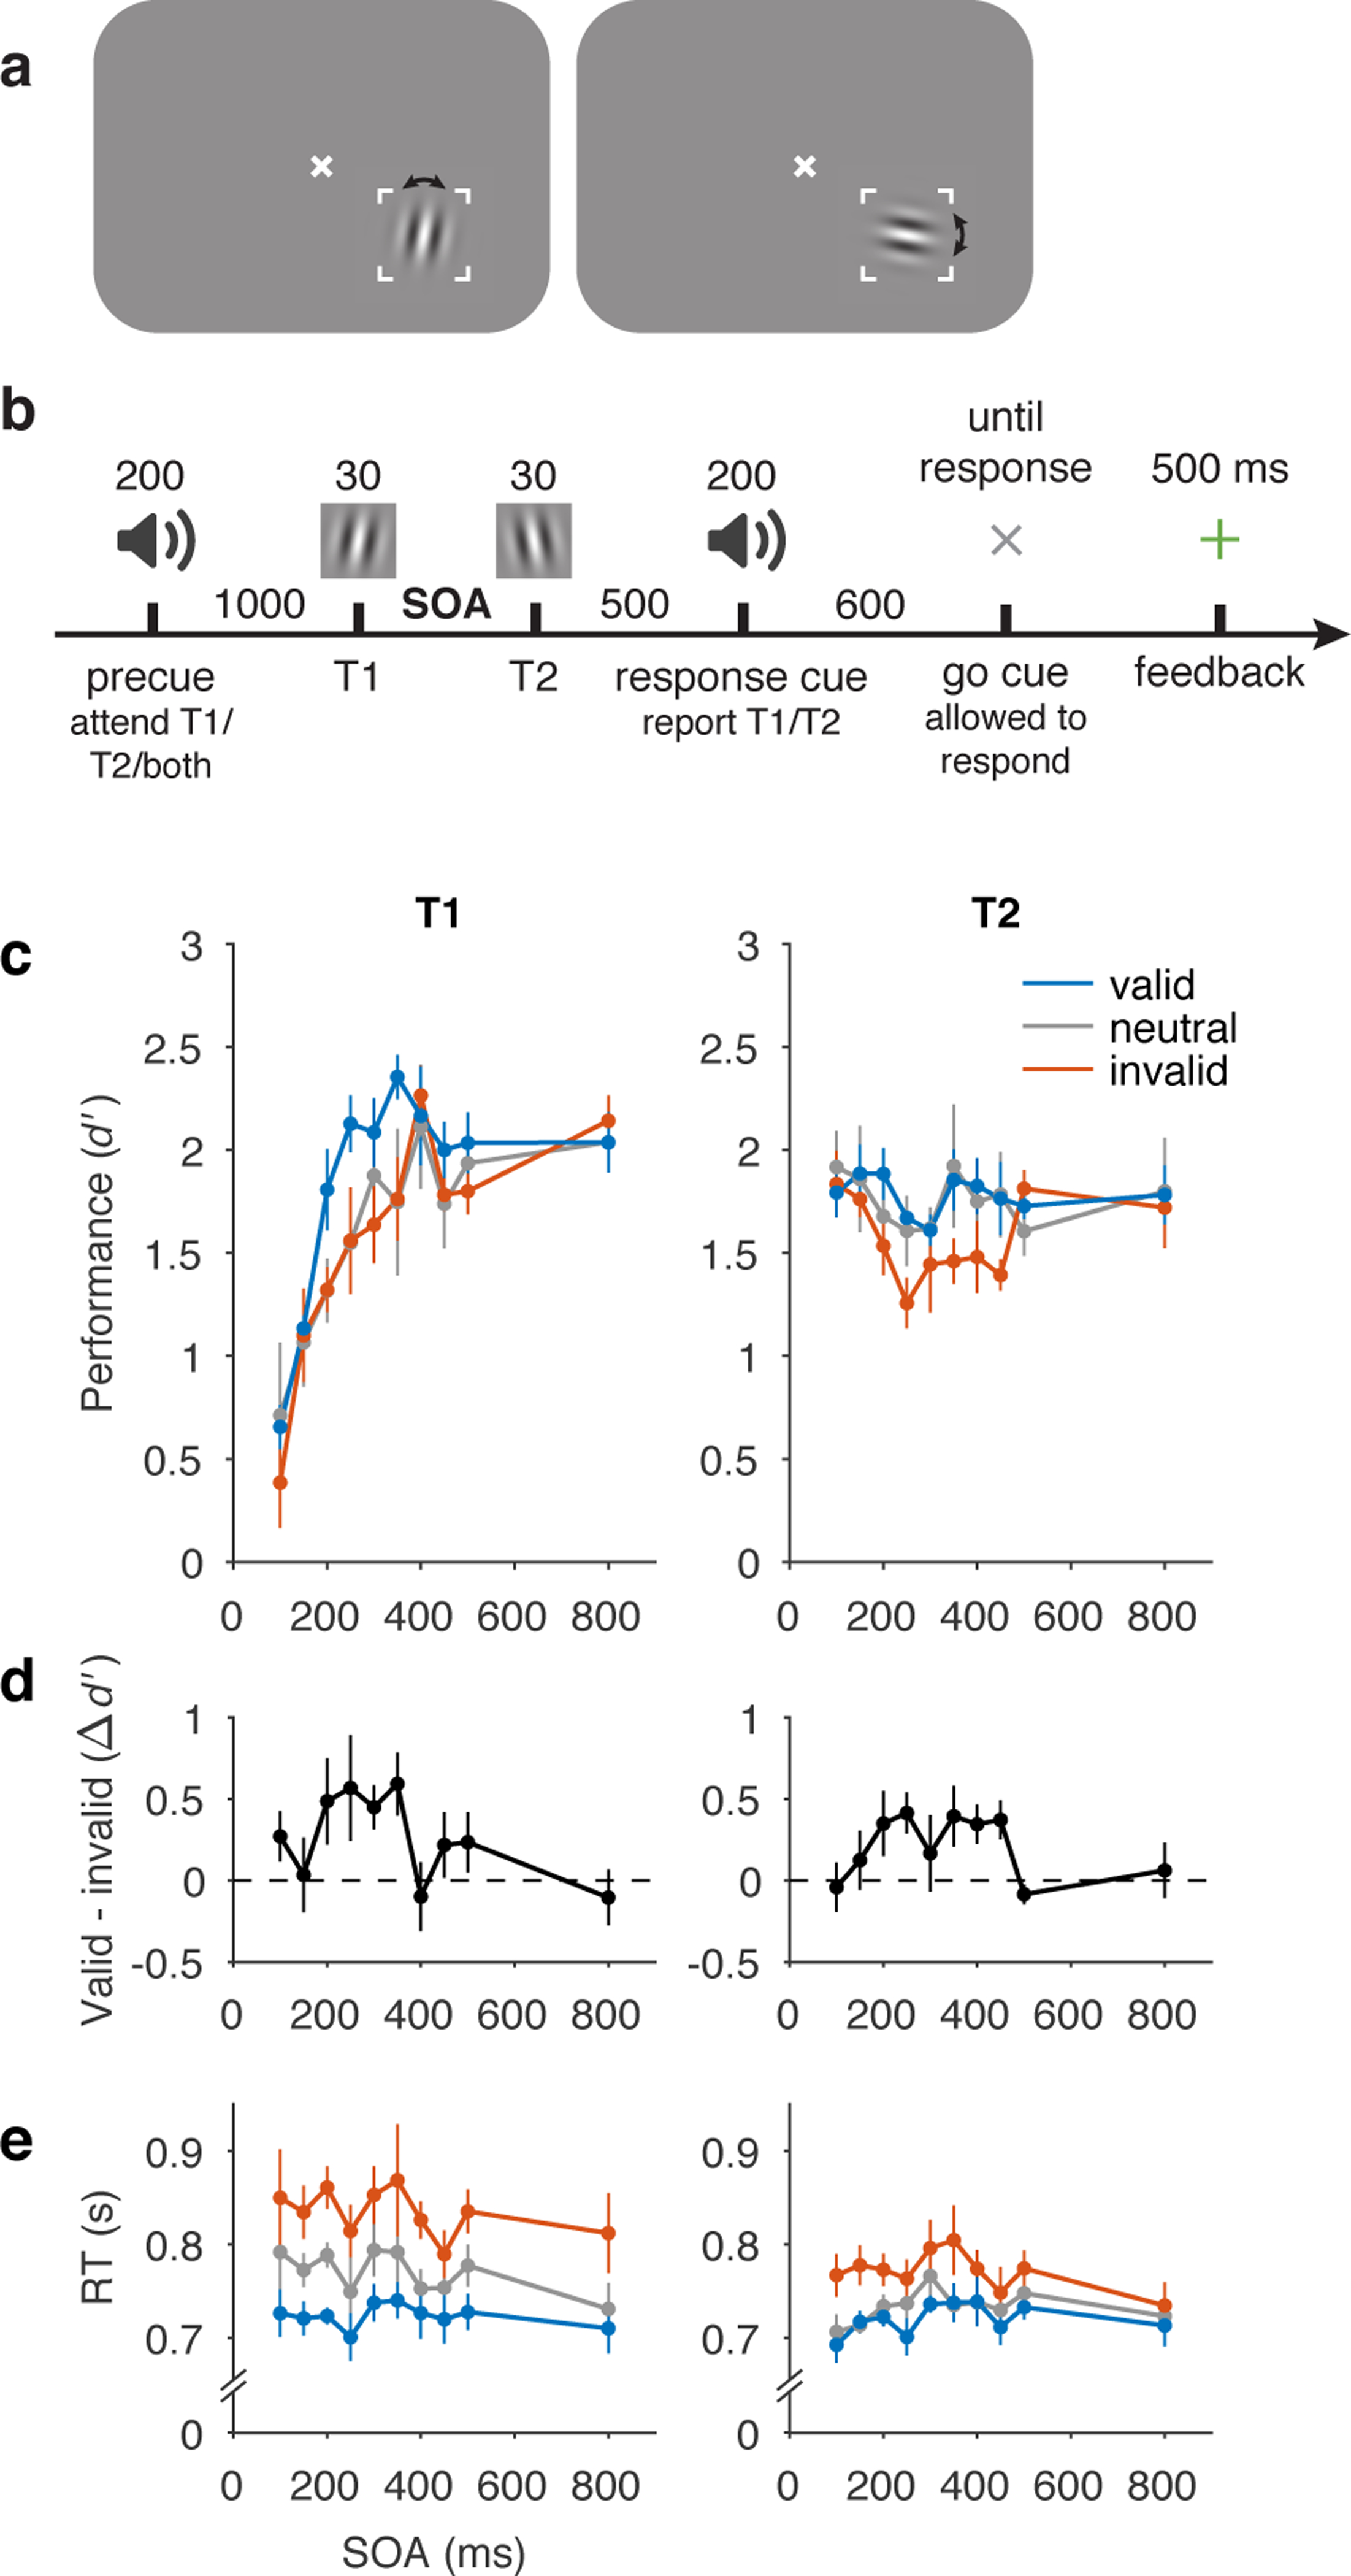
Behavioural protocol and data. a) Stimulus display and task schematic. Observers discriminated clockwise (CW) vs. counterclockwise (CCW) tilts about either the vertical (left) or horizontal (right) axis. (Arrows were not shown to observers.) b) Trial sequence. Tilts and axes were independent for T1 and T2. SOA varied across testing sessions from 100–800 ms but was fixed within each session. c) Perceptual sensitivity (d’) for each SOA, precue (valid, neutral, invalid), and target interval (T1, T2). Main effect of precue validity, F(2, 8) = 8.85, p = 0.0094, ηG2 = 0.048. d) Effect of precueing temporal attention on perceptual sensitivity (i.e., difference in performance between valid and invalid precues). Size of precueing effect depended on SOA, F(9, 36) = 3.13, p = 0.0069, ηG2 = 0.20. e) Reaction time (RT). Error bars in c and e are within-observers SEM computed separately for each target to reflect differences among conditions for each target. Error bars in d are SEM, n = 5.