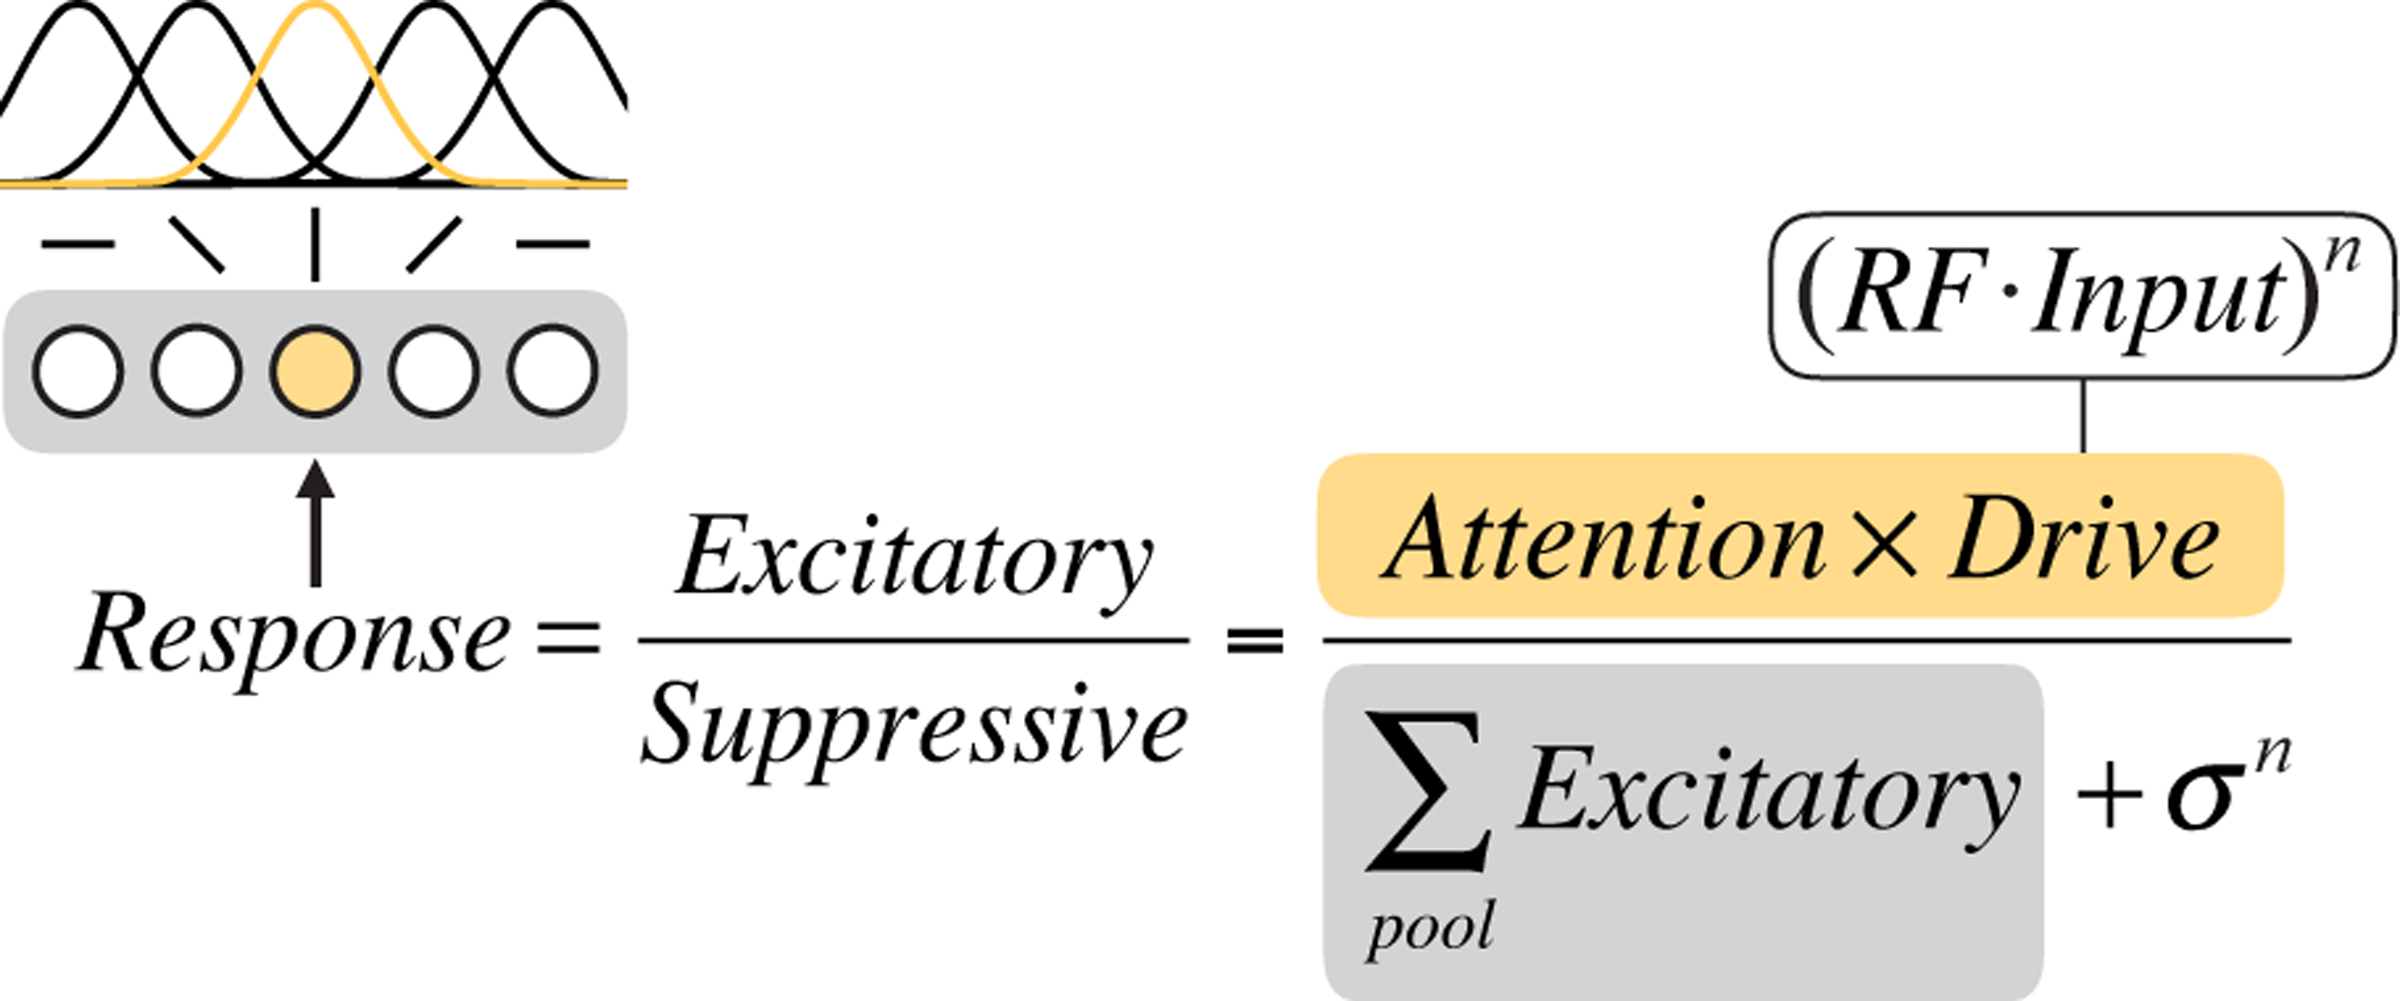
Figure 2.

Graphical depiction of the static Reynolds & Heeger normalization model of attention equation. We consider a population of orientation-tuned neurons (illustrated at left, with gray shaded background). The computation of the response of one of the neurons (shaded yellow, with corresponding yellow receptive field (RF)) is shown. The excitatory drive to that neuron is determined by its input drive and attentional modulation (equation text with yellow background). The suppressive drive is determined by the excitatory drives of all the neurons in the local population (equation text with gray background) plus a constant.
