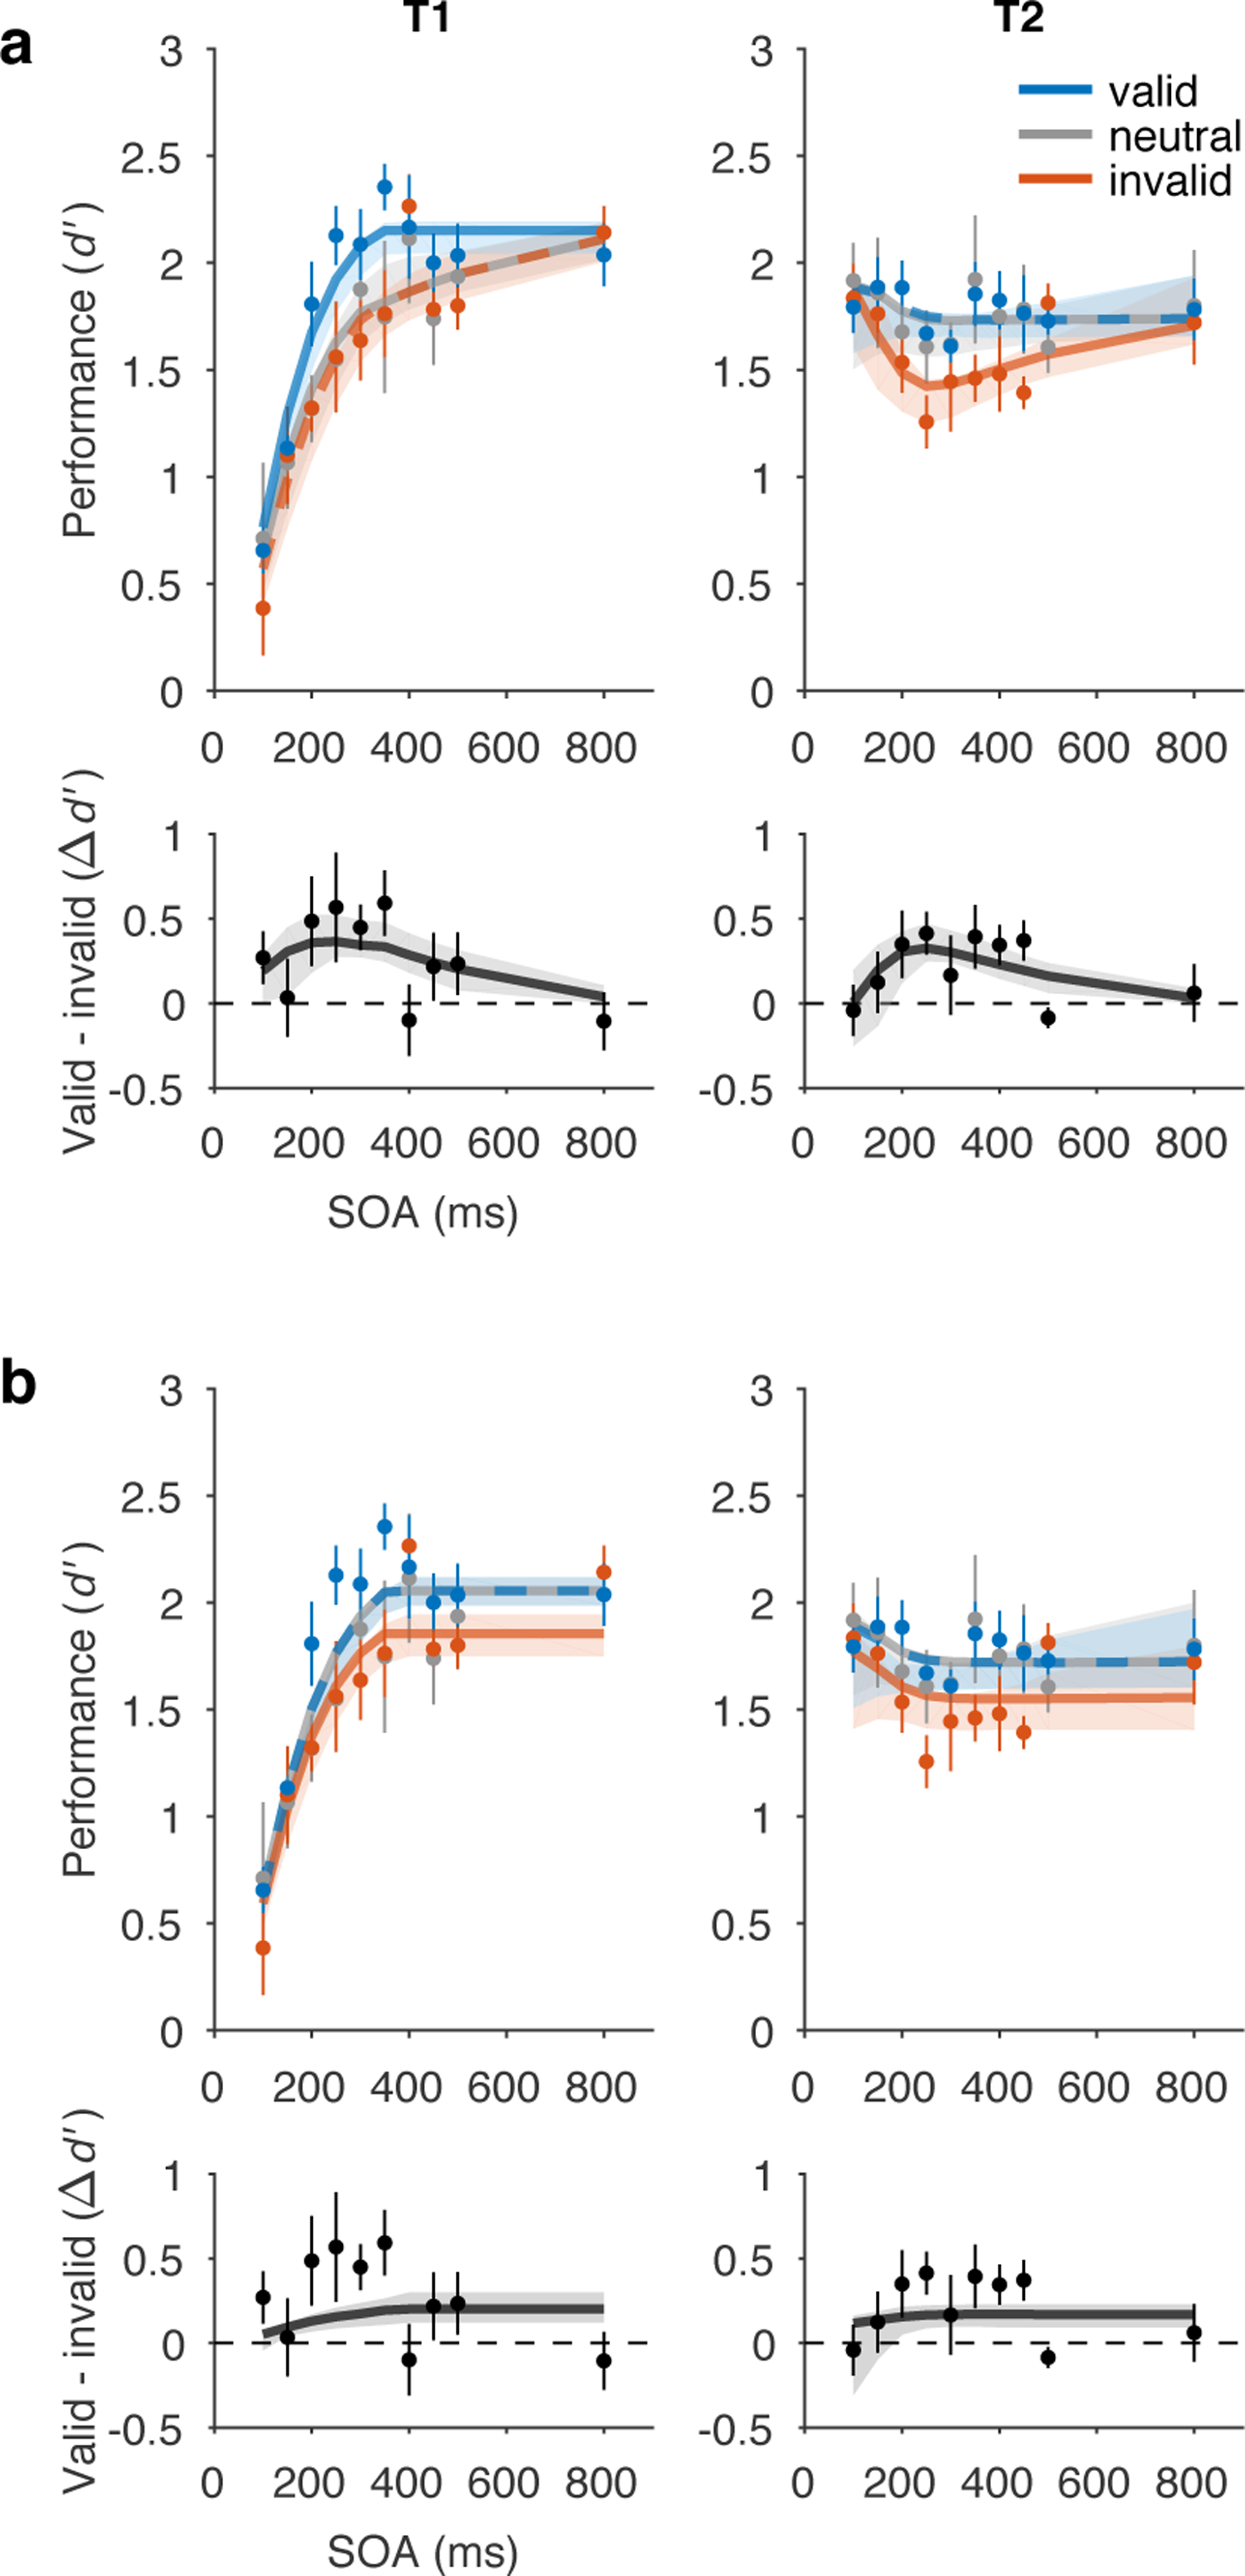
Figure 5.

Model fits to perceptual sensitivity data. a) Main model with a voluntary attention limit, R2=0.90. Top row, performance (d’). Bottom row, precueing effect. b) No limit model variant, R2=0.83. Main model fit better than no limit model variant, ΔAIC=26. Data points and error bars, behavioural performance (copied from Fig. 1, n = 5). Curved lines, model fits. Some curves are dashed to reveal overlapping model predictions. Shaded regions, bootstrapped 95% CI for model fits.
