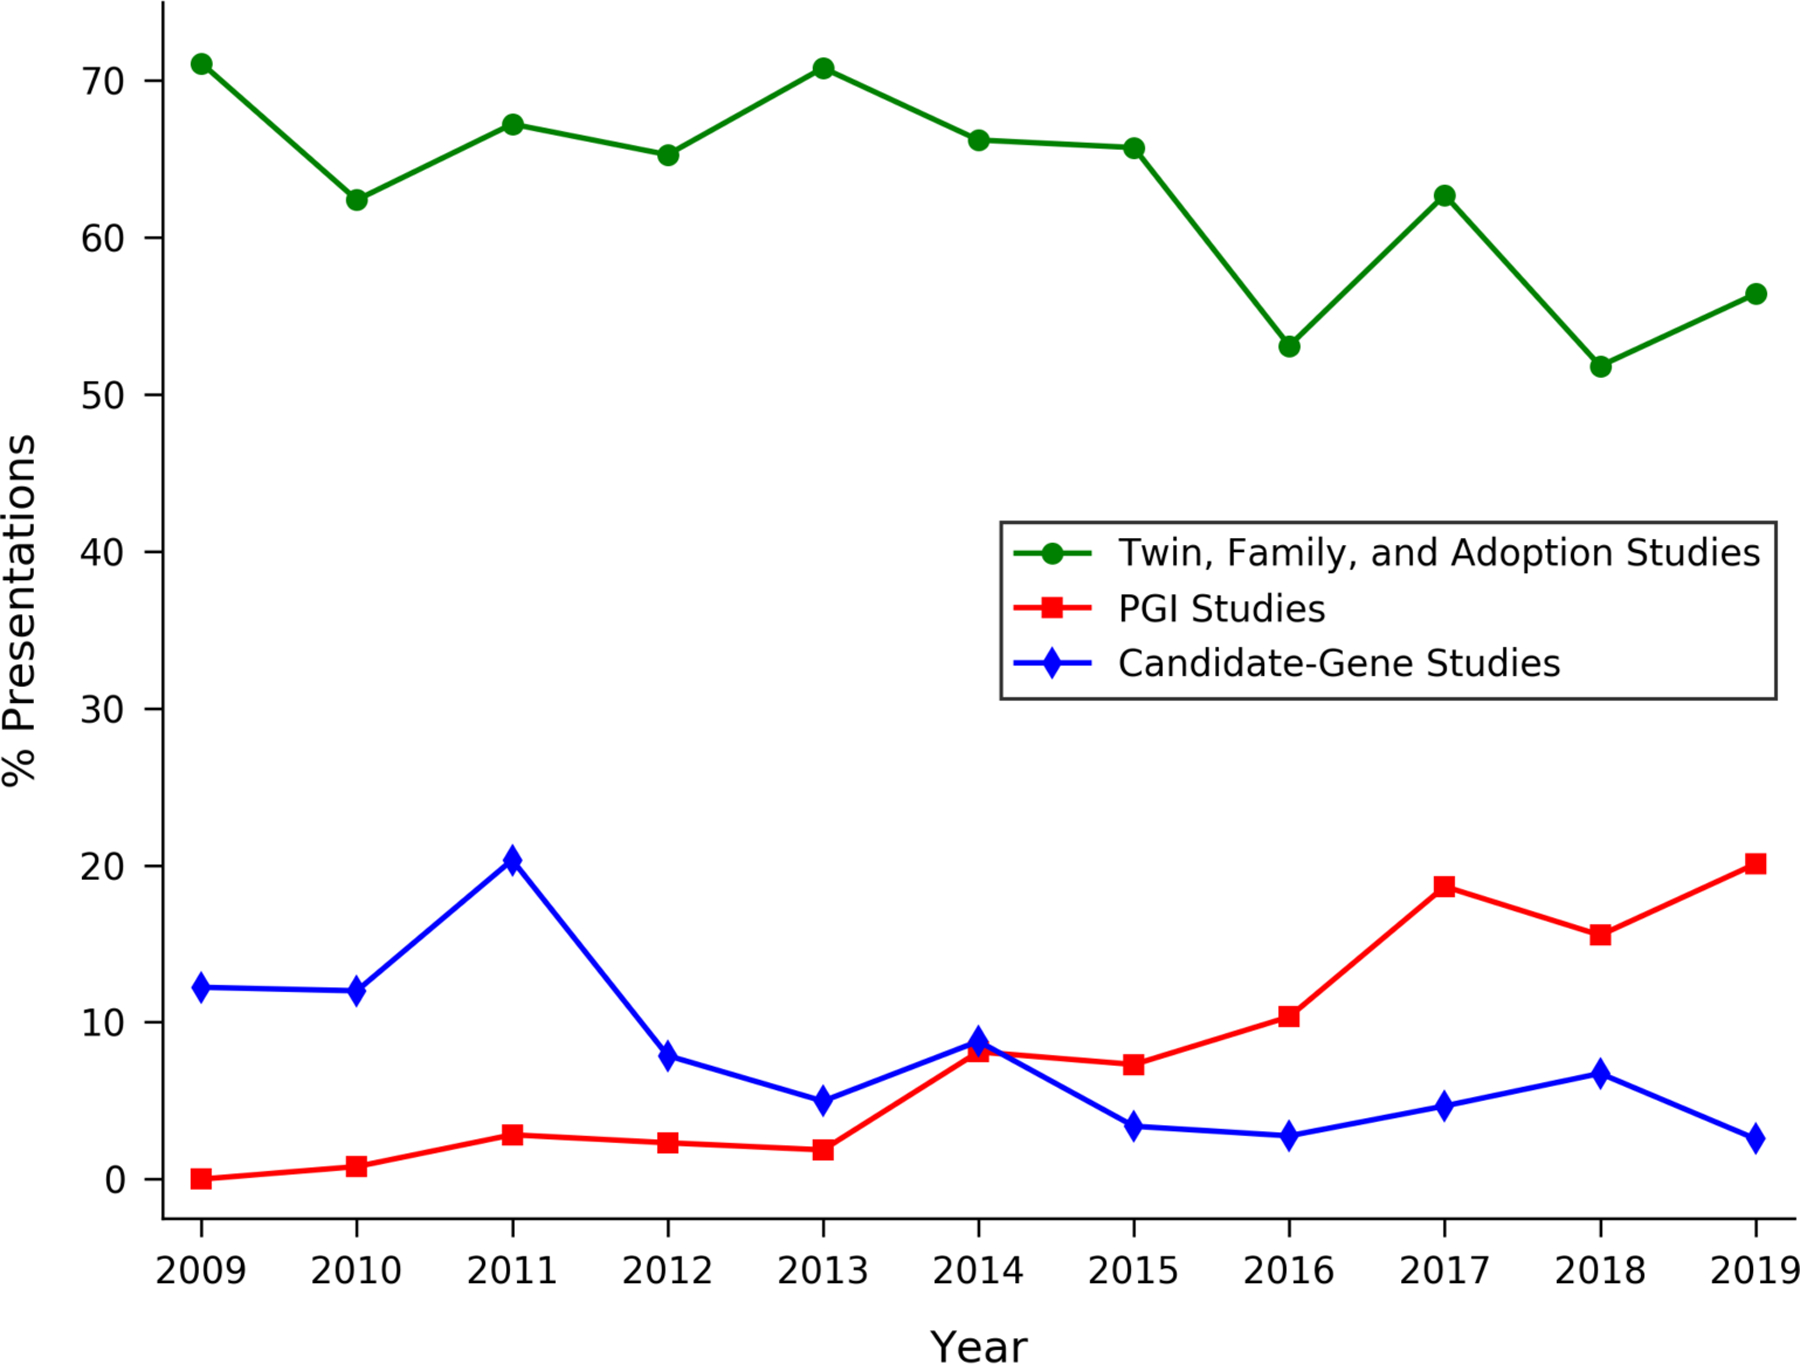
Figure 1. Type of study in presentations at Behavior Genetics Association Annual Meetings.

Notes: For a description of the data underlying this figure, see Methods. Out of 1,993 presentations in total (over the 2009–2019 period), the percentages that are in exactly 0, 1, 2, or 3 categories are 26.6%, 67.6%, 5.5%, and 0.2%, respectively.
