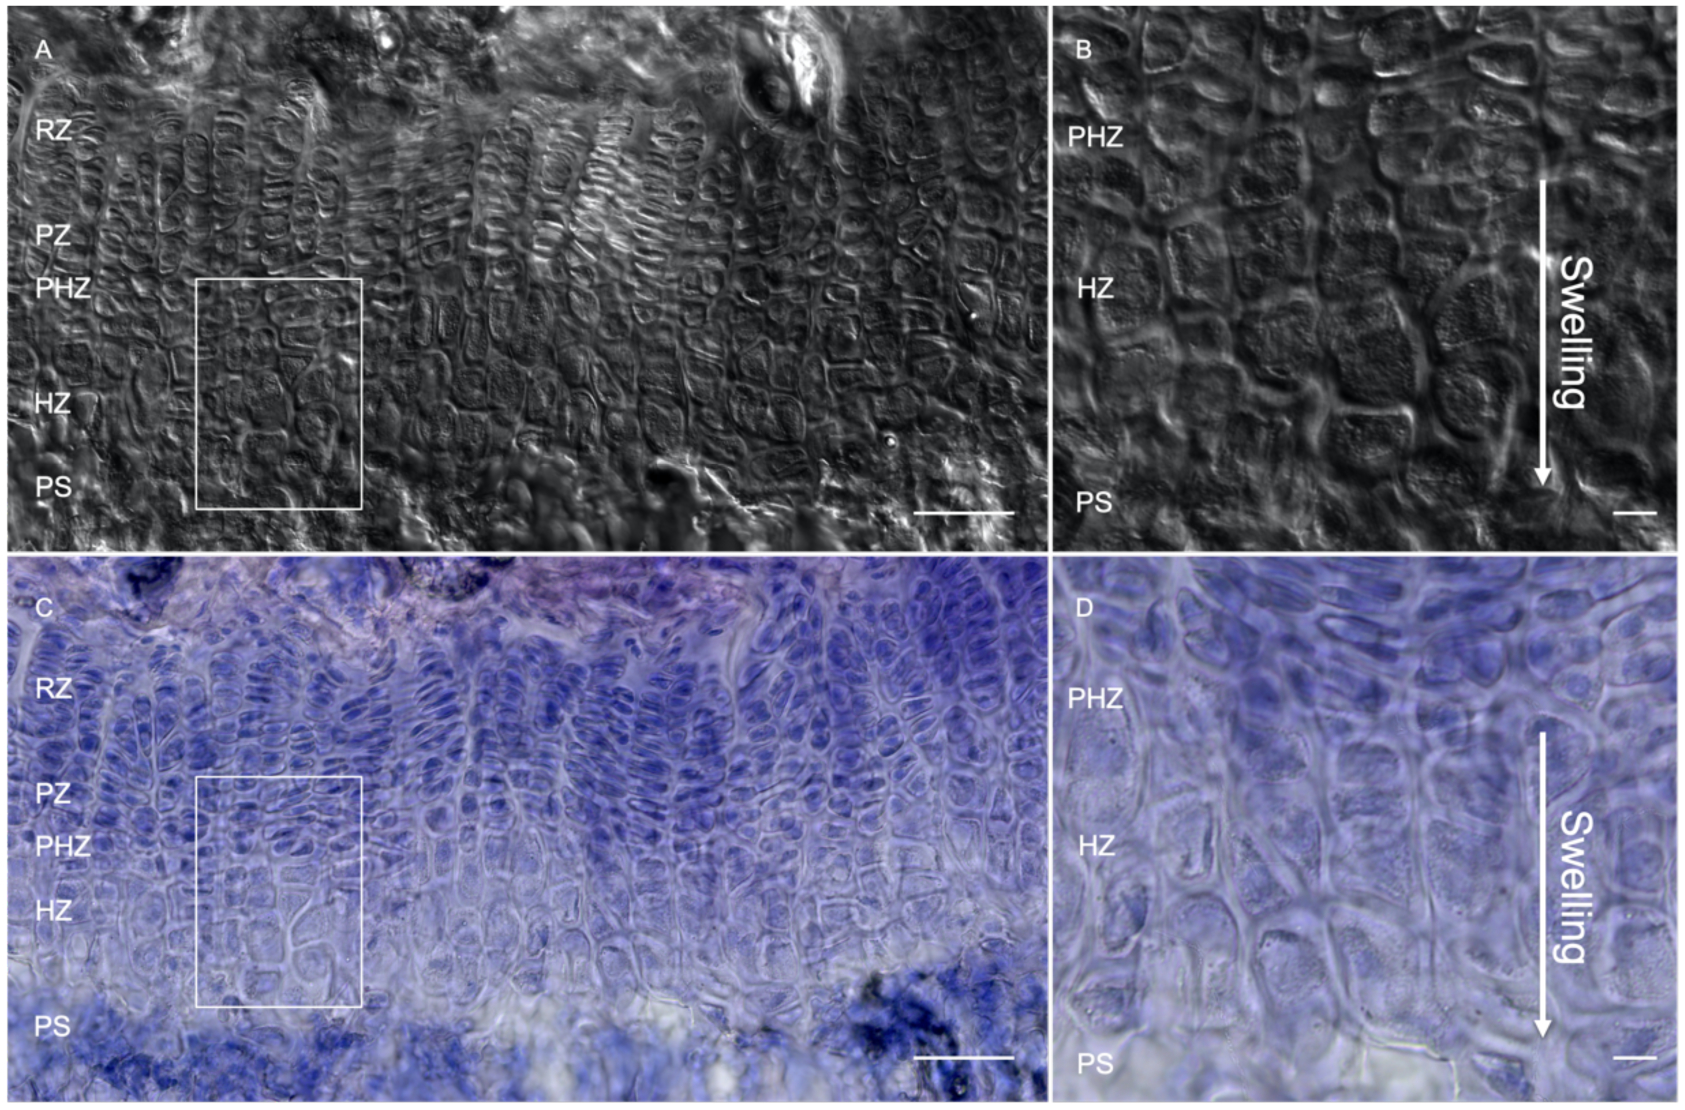
Figure 2. Morphological variation of hypertrophic chondrocytes.

Representative differential interference contrast (DIC) (A,B) and hematoxylin and eosin staining (C,D) of the growth plate at postnatal day 36 in a C57BL/6 mouse. Magnified images (B,D) denote cellular swelling and size variation of hypertrophic chondrocytes as they move towards the primary spongiosa. RZ: resting zone, PZ: proliferating zone, PHZ: pre-hypertrophic zone, HZ: hypertrophic zone, PS: primary spongiosa. Scale bars: 100 μM.
