
Fig. 4. Developmental changes in word-, face-, and limb-selectivity are linked.
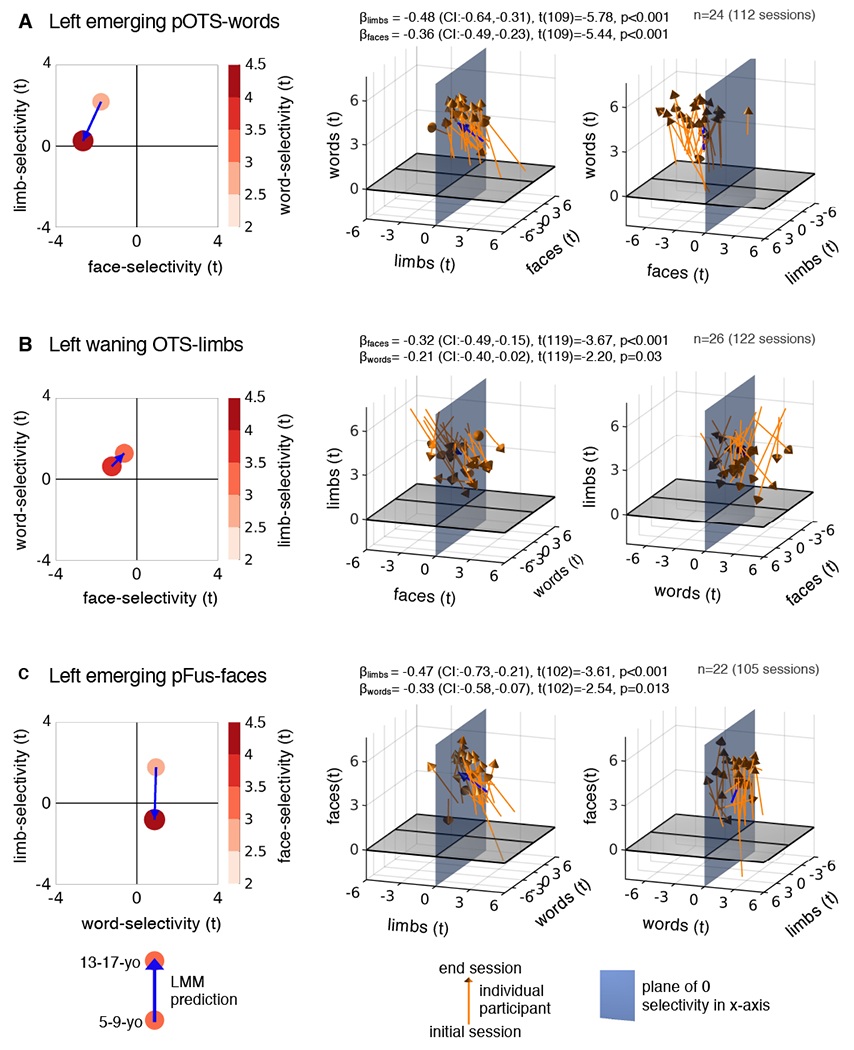
Left: LMM prediction (circle) of category selectivity to words (A), limbs (B), and faces (C) vs. selectivity to the other two categories in 5-9-year-olds and 13-17-year-olds. Middle: Individual participant data visualized in 3D. In each panel the variable on the z-axis is related to the x- and y-variables, this relationship is quantified in the model; βs, 95%-CI, t-values, degrees of freedom, and p-values are shown at the top. Full statistics in Supplementary Table 13; Orange arrows: Individual child data. Blue arrows: LMM prediction (same as left panel). Right: Rotated version of the plots in the middle column to enhance visibility of positive and negative values along the other horizontal axis. Right hemisphere in Extended Data Fig. 3.