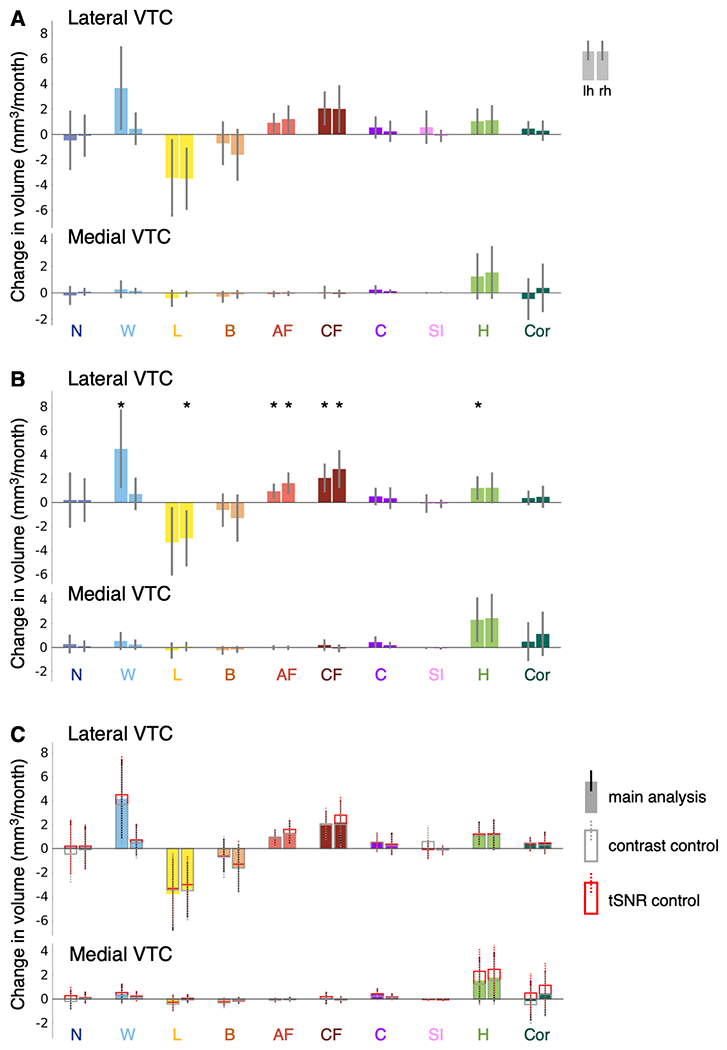
Extended Data Figure 1. Control analyses examining developmental increases and decreases in category-selective activation in lateral VTC.

LMM slopes indicating change in category-selective activation volume per month (n=128 sessions, 29 children). Error bars: 95% CI. If the CI does not cross the y=0 line, this indicates that the slope is significantly different than 0 (before FDR-correction). (A) Slopes for the age predictor for models in which adult faces, child faces, limbs, and words are excluded as control categories from the contrast. No effects survive FDR-correction. (B) Slopes for the age predictor for models including both age and time series signal-to-noise ratio (tSNR) as predictors. Significant development after FDR-correction (p<0.05) is indicated by asterisks. (C) Slopes for the main analysis (filled bars), the contrast control (open bars with gray outline) and the tSNR control (open bars with red outline) are overlaid to illustrate the changes in effect size across the different analyses. Full statistics in Supplementary Tables 3–4,6–7. Related to Fig. 1.
