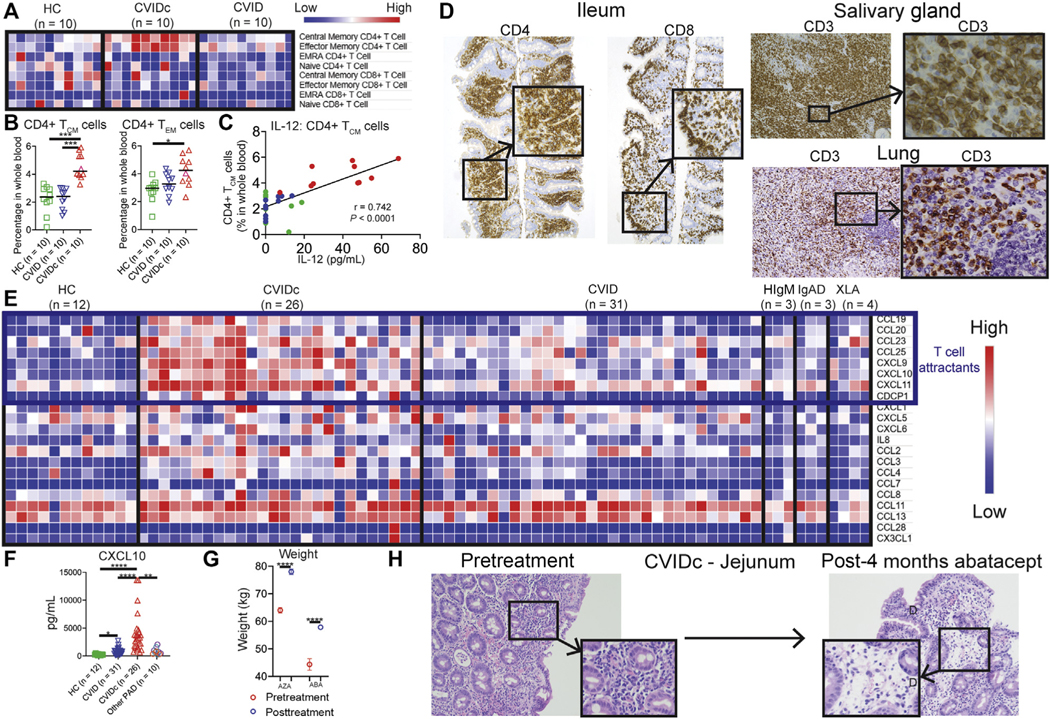
FIG 5.

CVIDc cytokine dysregulation corresponds with T-cell activation and infiltration of tissues. A and B, CD4+ and CD8+ T-cell subsets as percentages of whole blood. C, Plasma IL-12 correlation with CD4+ TCM cells. D, Representative CVIDc biopsies illustrating T-cell infiltration. E, Olink measurement of plasma chemokines. F, Luminex measurement of plasma CXCL10. G, Weight before and after immunomodulatory therapy (AZA 5 azathioprine, ABC 5 abatacept) in subjects with CVIDc. Data points are means with SD 3 weights measured before and after treatment. G, Ileum biopsies before and after abatacept in subject P22 with CVIDc. **P < .01, ***P < .001, ****P < .0001.
