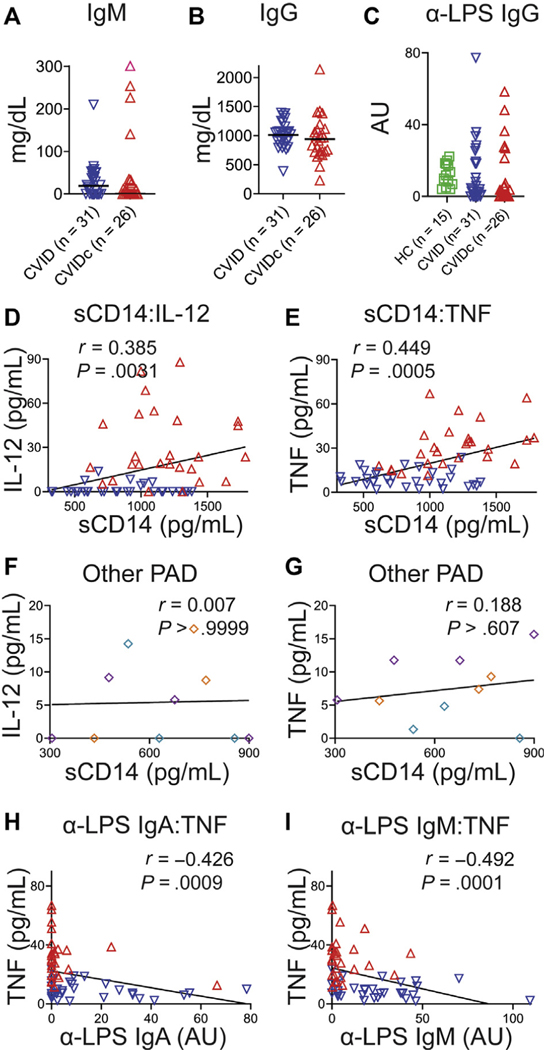
FIG E3.
Relationship of plasma antibodies and cytokine levels. (A) Plasma IgM and (B) IgG. C, Plasma levels of LPS-specific IgG. (D) Correlation of sCD14 with IL-12 and (E) TNF. Plasma TNF levels were higher in those with lower LPS-specific IgM. Red dots denote subjects with CVIDc, and blue dots denote subjects with uncomplicated CVID. (F) No correlation between plasma sCD14 and IL-12 and (G) TNF in other PAD (purple denotes XLA, teal denotes HIgM, orange denotes IgAD). H, Correlation of plasma LPS-specific IgA with TNF. I, Correlation of plasma LPS-specific IgM with TNF. HIgM, Hyper-IgM syndrome; IgAD, selective IgA deficiency; r, Spearman rank correlation coefficient; XLA, X-linked agammaglobulinemia.

