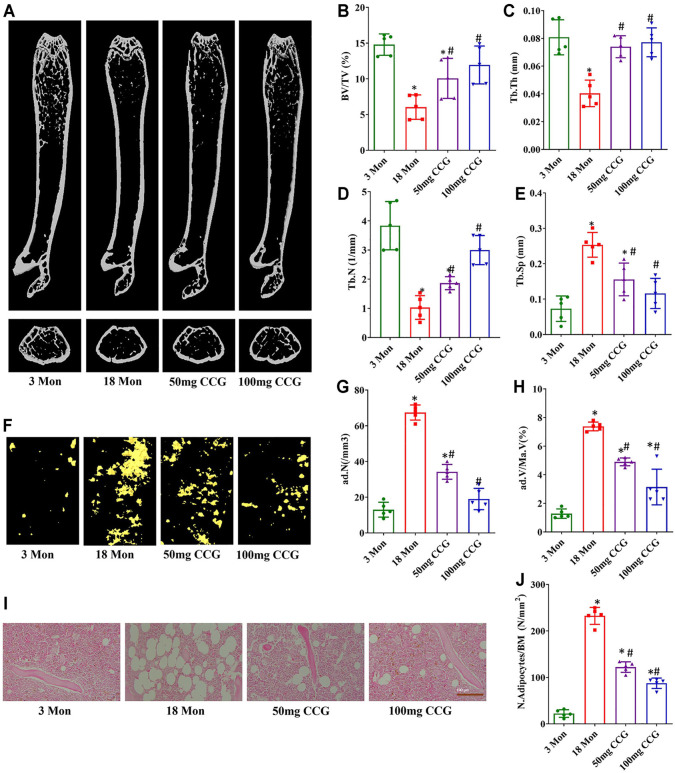
FIGURE 1.
CCG ameliorated bone loss and marrow adiposity of aging mice. (A–E) Representative μ-CT images of femurs from the animals in different groups to acquire the quantitative analysis of trabecular bone. (F–H) Representative μ-CT images of OsO4 staining of femurs from the animals in different groups to acquire the quantitative analysis of the volume of adipocytes. (I, J) Representative images of H&E staining to show the ratio of adipocyte number to the area of bone marrow. Scale bar: 100 μm (n = 5) *p < 0.05 vs. the 3-mon mice group; #p < 0.05 vs. the 18-mon mice group.

