FIGURE 2.
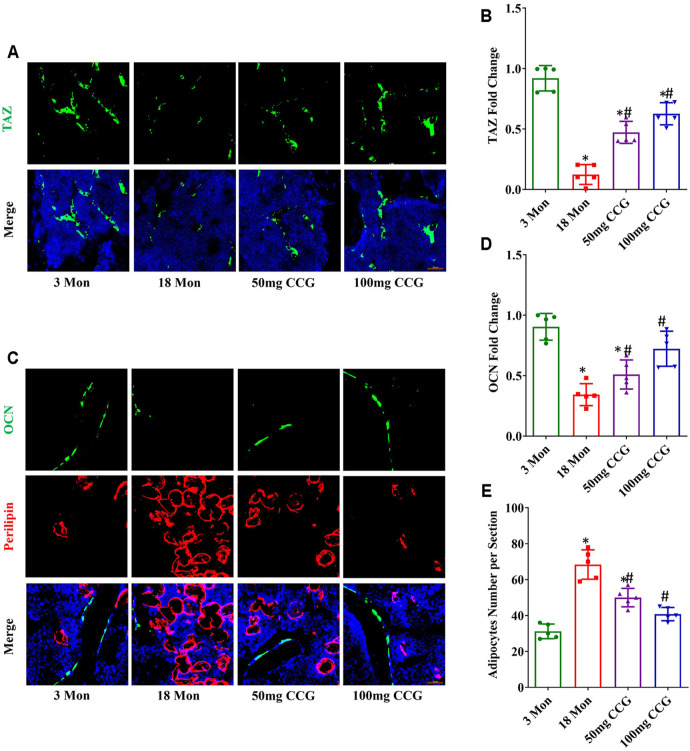
CCG targeted TAZ to regulate the switch from adipogenesis to osteogenesis of BMSCs in vivo. (A, B) Representative images and quantitative analysis of TAZ (green) expression in the mice femurs from different groups. (C–E) Immunofluorescent staining of OCN (green) and perilipin (red) in the mice femurs and the relevant quantitative analysis. Scale bar: 50 μm (n = 5) *p < 0.05 vs. the 3-mon mice group; #p < 0.05 vs. the 18-mon mice group.

