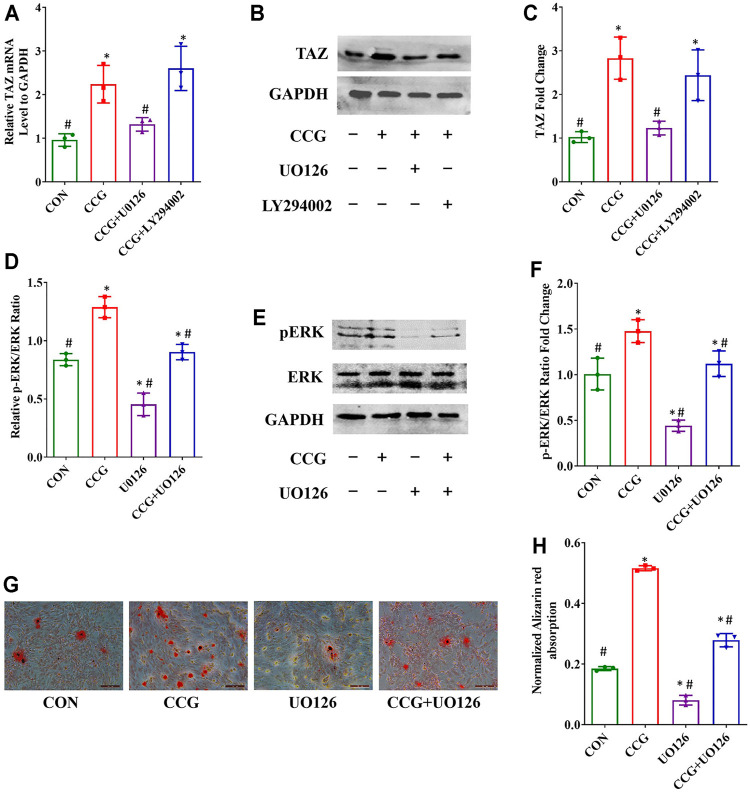
FIGURE 5.
Osteogenic differentiation and TAZ expression were increased by CCG treatment by increasing the p-ERK/ERK ratio. (A–C) Relative mRNA and protein levels to GAPDH of TAZ at Day 3 in different groups. (D–F) Relative mRNA and protein levels of p-ERK at Day 3 in different groups. (G, H) Representative images of AR-S showed the calcium deposits were influenced by CCG treatment. Scale bar: 100 μm *p < 0.05 vs. the control group (cells cultured in osteogenic medium during osteogenesis); #p < 0.05 vs. the CCG administration group.

