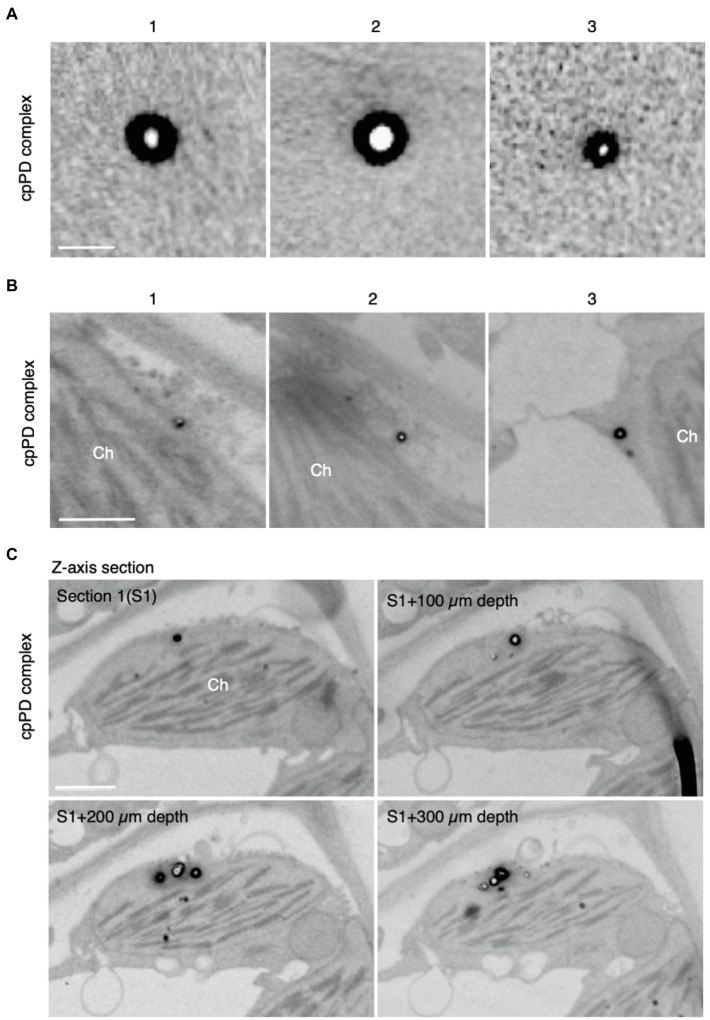
Figure 2.
Field emission-scanning electron microscopy (FE-SEM) analysis of KH-AtOEP34-pDNA complexes. (A,B) Three different images of the KH-AtOEP34–pDNA (cpPD complexes; 1–3) in agarose gel (A) and around chloroplasts (Ch; B) are shown. (C) Four consecutive z-axis sections showing cpPD complexes on the chloroplast surface. The sections are cut at every 100 μm depth. Bars=100 nm in (A) and 1μm in (B,C).

