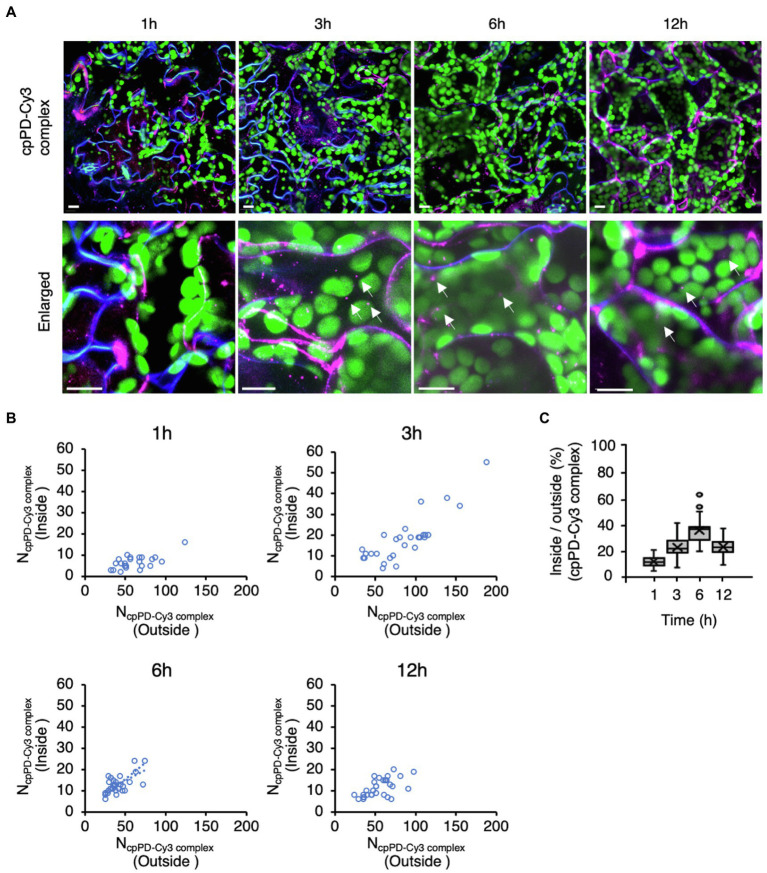
Figure 3.
Time-dependent penetration of KH-AtOEP34–pDNA complexes into leaf mesophyll cells. (A) Subcellular localization of KH-AtOEP34–pDNA complexes labeled with Cy3 (cpPD-Cy3; magenta) in Arabidopsis leaf mesophyll cells at 1, 3, 6, and 12h after infiltration. Enlarged images are shown in the lower panels. The plasma membrane (blue) is stained with FM4-64. Chloroplasts (green) are visualized as chlorophyll autofluorescence. Scale bars denote 10μm. (B) Scatterplots showing the relative spatial distribution of cpPD-Cy3 complexes at the different time points shown in (A). Each circle represents a cell with the number of cpPD-Cy3 complexes outside (x-axis), NcpPD-Cy3 complex (Outside), and inside (y-axis), NcpPD-Cy3 complex (Inside), the cell (n>24). (C) Ratio of the number of cpPD-Cy3 complexes inside and outside cells shown in (B), as box plots. The horizontal lines represent the mean and the cross represents the median. Circles represent outliers.

