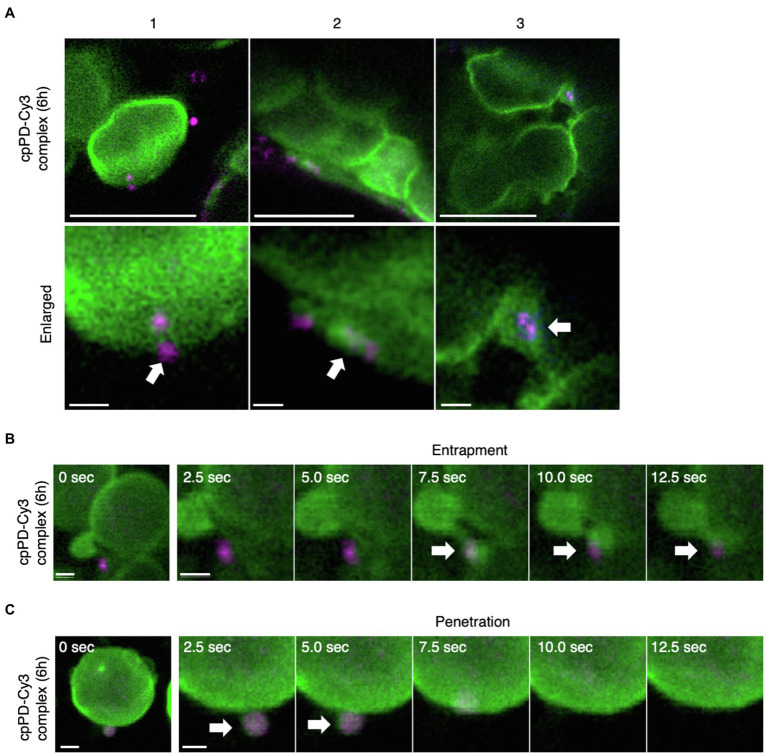
Figure 4.
KH-AtOEP34–pDNA complexes localize to the chloroplast outer membrane. (A) Three representative examples (1–3) of KH-AtOEP34–pDNA localization patterns, as visualized by Cy3 fluorescence (cpPD-Cy3; magenta) around chloroplasts (green). Bars=5μm. Enlarged images in the lower panels represent cpPD-Cy3 complexes associated with (1), being enveloped by (2), or integrated into (3), the chloroplast outer membrane (green). Arrows denote cpPD-Cy3 complexes. Bars=1μm. (B,C) Time-lapse images illustrating entrapment (B) and incorporation (C) of cpPD-Cy3 complexes by the chloroplast outer membrane.

