FIGURE 4.
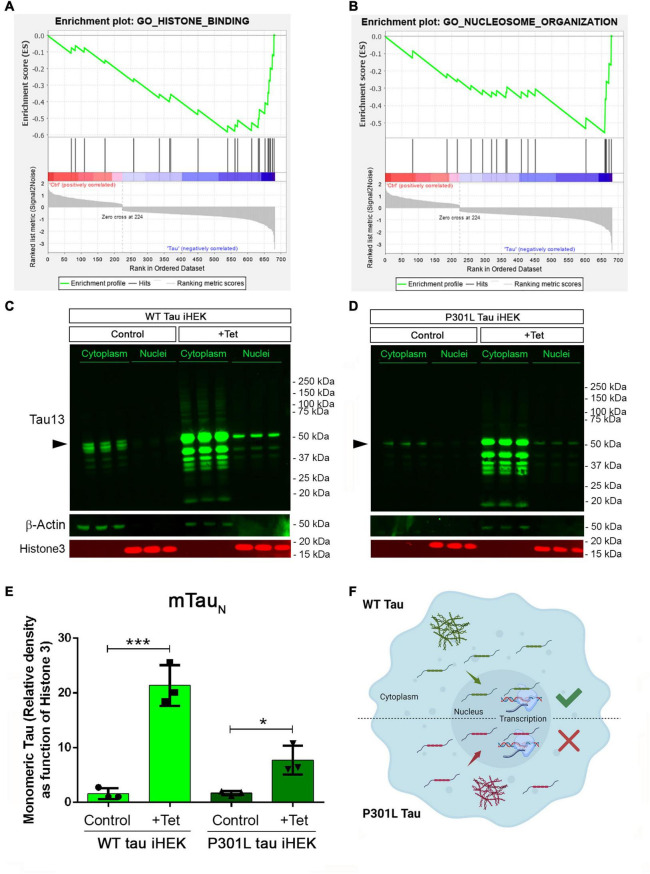
Tau nuclear shuttling. (A) GSEA GO-Histone Binding heat map in WT tau. (B) GSEA GO-Nucleosome organization heat map in WT tau. (C) Immunoblot (IB) with Tau13 (1:1,000) and β-Actin (1:1,000) of cytoplasm and nuclear fraction from WT (left panel) and (D) P301L (right panel) tau induced with Tet. Monomeric tau is indicated by rightwards filled arrows (E) Relative density of nuclear monomeric tau (mTauN, normalized with Histone3). Unpaired t-test has been performed to compare column means [(–) WT tau vs. WT tau ***p = 0.0009, (–) P301l tau vs. P301L tau *p = 0.0169]. (F) Schematic model on tau nuclear import in the two iHEK cell lines.

