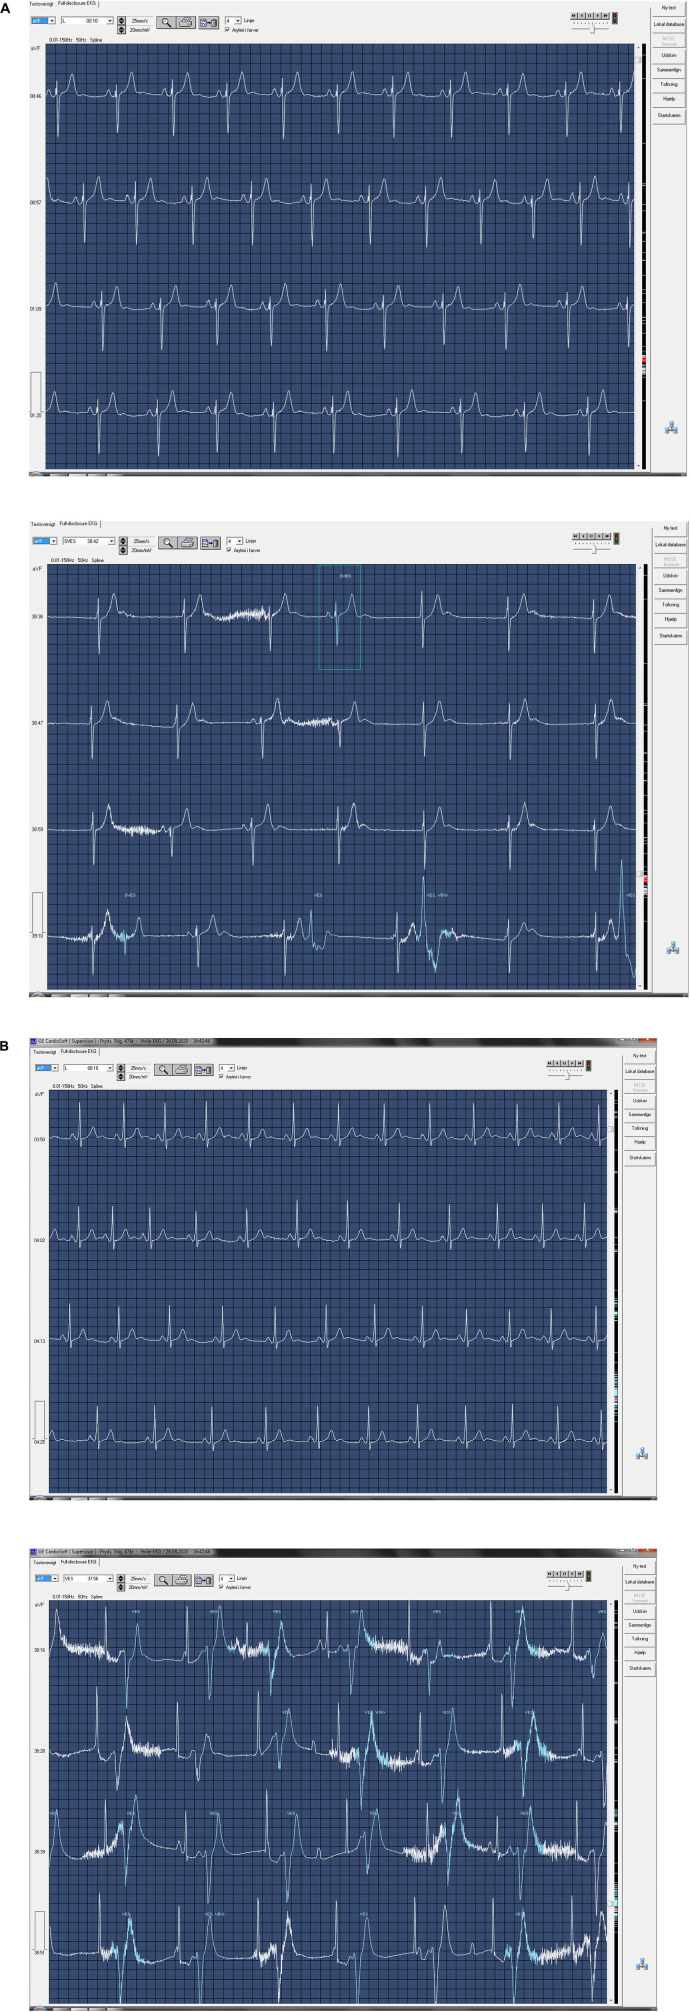
FIGURE 7.
ECG at rest and ECG during maximum dry apnea in two subjects. (A) Sinus rhythm at rest (top) and nodal rhythm during maximum dry apnea (bottom). Recorded at 25 mm/s. Continues on next page. (B) Sinus rhythm at rest (top) and second-degree atrioventricular dissociation during maximum dry apnea (bottom). Recorded at 25 mm/s.

