FIGURE 5.
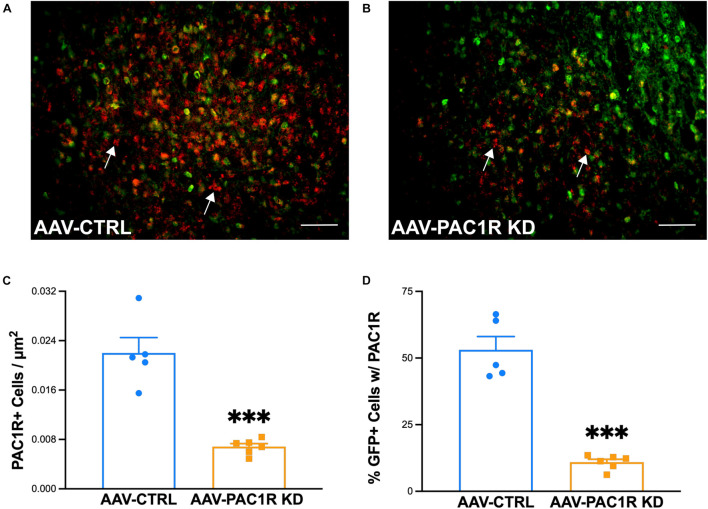
Effect of NAcc Shell PAC1R shRNA knockdown on PAC1R levels in the NAcc Shell of rats (n = 6/group). (A,B) Representative images of PAC1R (red) and GFP (green) expression in the NAcc Shell of AAV-CTRL and AAV-PAC1R KD rats (C) NAcc Shell PAC1R shRNA knockdown rats (“AAV-PAC1R KD”) showed a significant reduction in the number of PAC1R positive cells in the NAcc Shell, compared to AAV controls (“AAV-CTRL”). (D) NAcc Shell PAC1R shRNA knockdown also significantly reduced the number of PAC1R positive cells specifically in virally infected cells (GFP-labeled cells). White arrows point to example PAC1R-labeled cells. Scale bars represent 100 μm. Data represent Mean ± SEM. ∗∗∗p ≤ 0.001.

