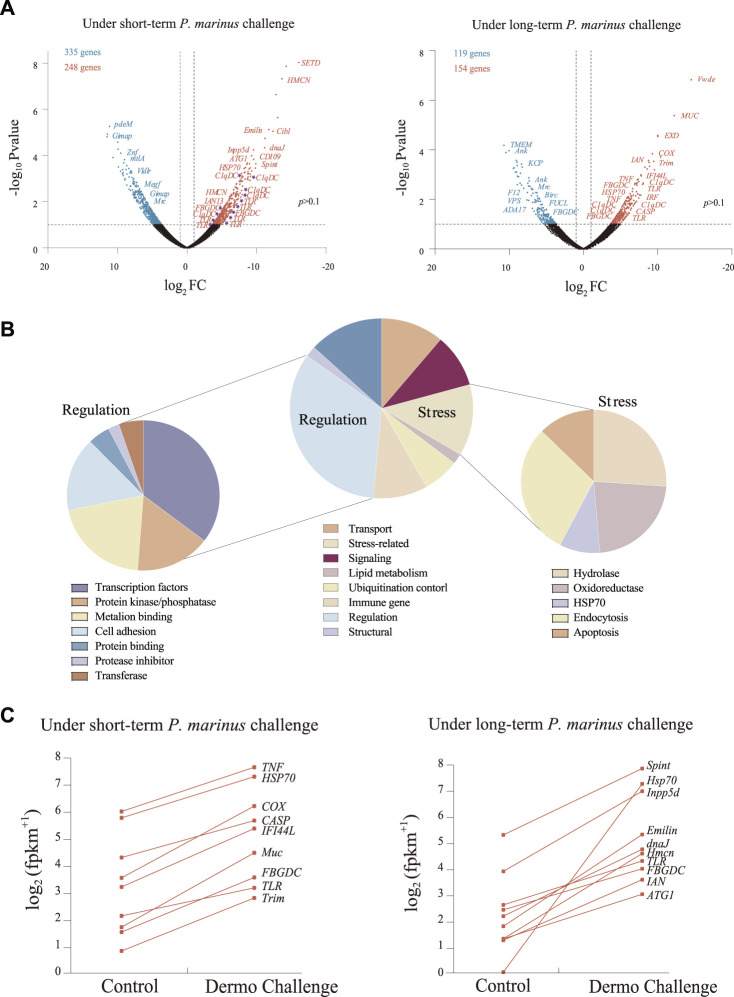
FIGURE 2.
Transcriptional changes induced by P. marinus in C. virginica. (A), Volcano plots of transcriptional change under short-term and long-term P. marinus challenge. Blue points represent downregulated genes, red points represent upregulated genes, and black points represent non-differentially expressed genes. (B), Functional annotation of differentially expressed genes under P. marinus challenge. (C), Immune-related genes significantly up-regulated after dermo challenge.

