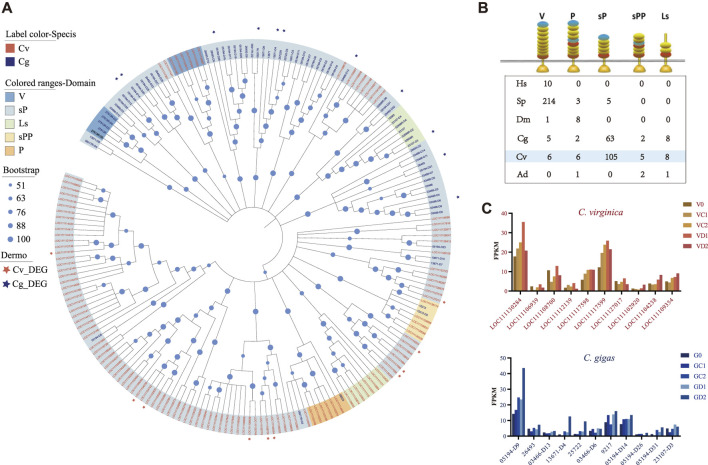
FIGURE 5.
Expansion of TLRs and divergent expression patterns under P. marinus challenge between C. gigas and C. virginica. (A), Phylogenetic tree constructed with the maximum likelihood method showing lineage-specific expansion of TLRs in C. gigas (red font) and C. virginica (blue font). Red and blue asterisks represent the differentially expressed TLRs in C. gigas and C. virginica, respectively. (B), Comparison of TLRs with different domain architectures in: human (Homo sapiens-Hs), sea urchin (Strongylocentrotus purpuratus-SP), fruit fly (Drosophila melanogaster-Dm), Pacific oyster (Crassostrea gigas-Cg), Eastern oyster (Crassostrea virginica-Cv), and staghorn coral (Acropora digitifera-Ad). LRRCT in red, LRRNT in blue and LRR in yellow. Toll/interleukin-1 receptor (TIR) domains are shown as gold triangles. (C), Diverse expression pattern of the differentially expressed TLRs, marked with asterisks in (A), during P. marinus challenge in C. gigas (Top) and C. virginica (Bottom).

