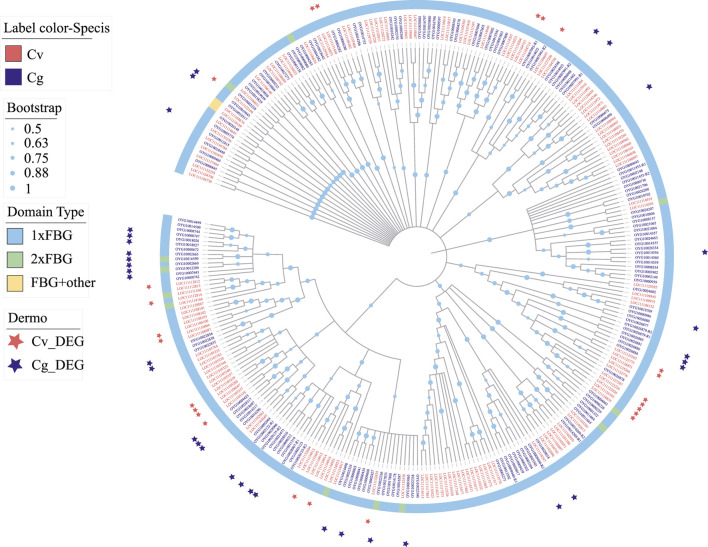
FIGURE 8.
Expansion and phylogeny of FBGDC gene family in C. virginica (red font) and C. gigas (gray font). The phylogenetic tree is constructed with the maximum likelihood method showing lineage-specific expansion of FBGDC in C. virginica (red font) and C. gigas (gray font). Different color backgrounds represent different domain composition types, and the red and gray asterisks represent differentially expressed FBGDCs under P. marinus challenge in C. virginica and C. gigas, respectively.

