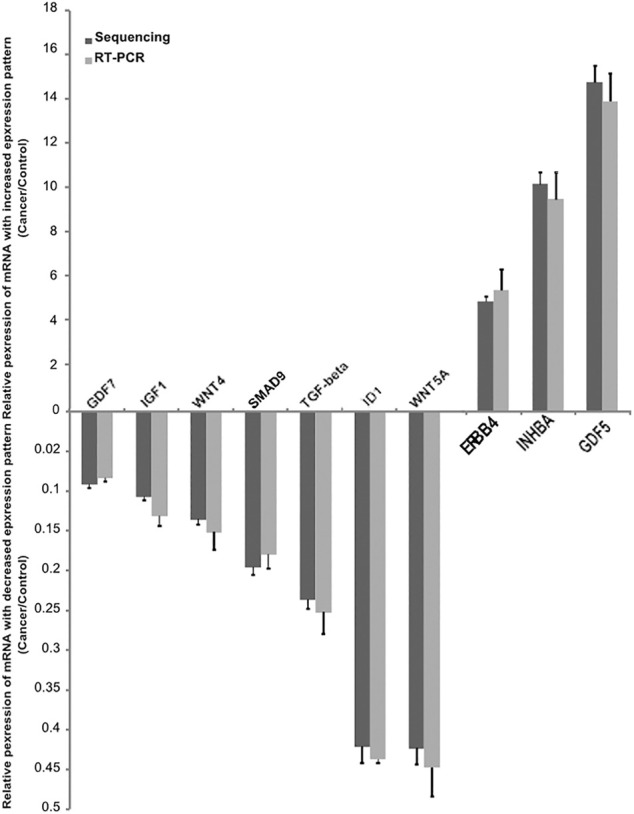
FIGURE 6.

Confirmation of the differentially expressed mRNAs between cancer and control endometrium tissue. Validation of the expression of 10 mRNAs by quantitative real-time PCR, showing increased expression of mRNAs (3) and decreased mRNA (7). The real-time PCR data with bars represent a mean ± SD from 3 independent experiments, and the sequencing data with bars represent the 95% CI.
