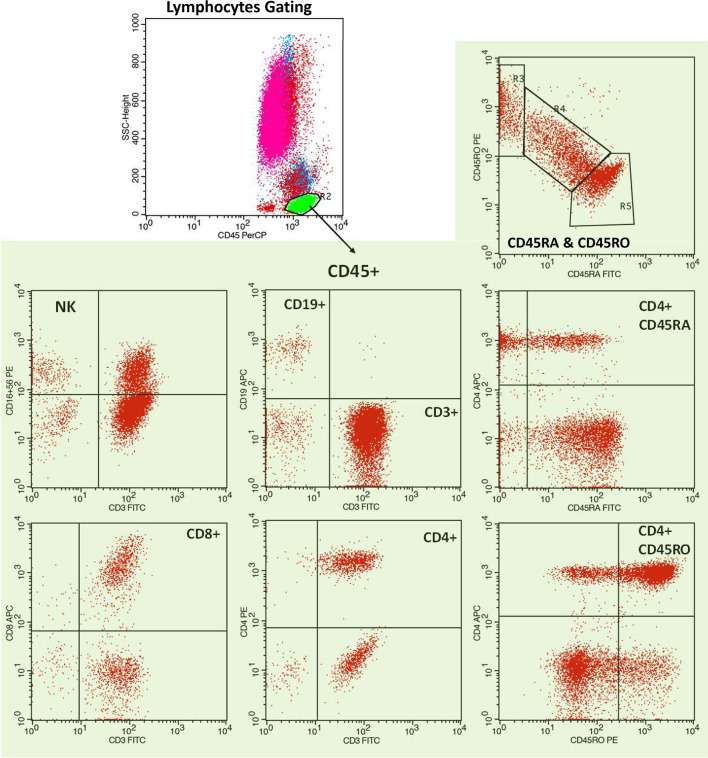
Figure 1.
Representative flow cytometric analysis of a hemodialysis patient. Representative dot plots depicting lymphocyte gating with B-lymphocytes (CD19+), and T lymphocytes (CD3+), CD4+ T cells, CD8+ T cells, naïve (CD45RA+) and memory (CD45RO+) T cell isoforms, naïve (CD4+CD45RA) T helper cells and memory (CD4+CD45RO) T helper cells, NK cells (CD3-CD16+CD56+) and NKT cells (CD3+CD16+CD56+).

