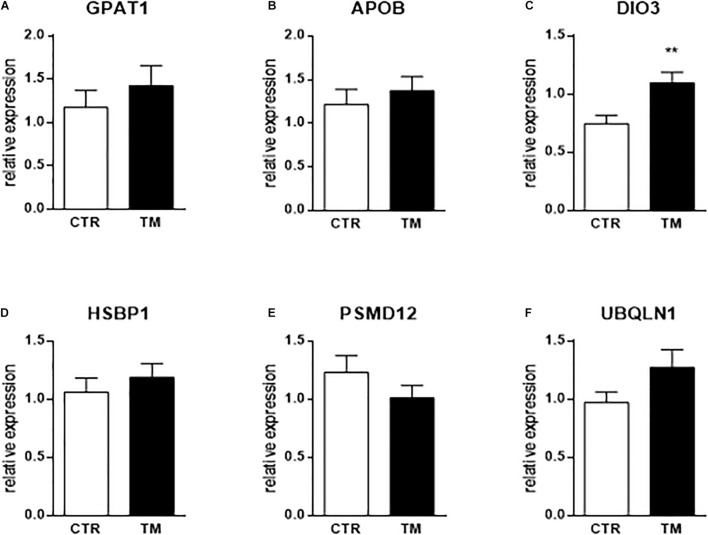
FIGURE 3.
Hepatic relative expression at the end of the heat treatment (E27) of genes influenced by TM before or after overfeeding. Column representation of the relative expression of GPAT1 (A), APOB (B), DIO3 (C), HSBP1 (D), PSMD12 (E) and UBQLN1 (F) at the end of the thermal manipulation in the liver of control (CTR) or thermal manipulated (TM) duck embryos. Data are presented as mean +/– SEM (n = 16–19). **P < 0.01. The absence of a star means that there is no statistical difference between the groups.

