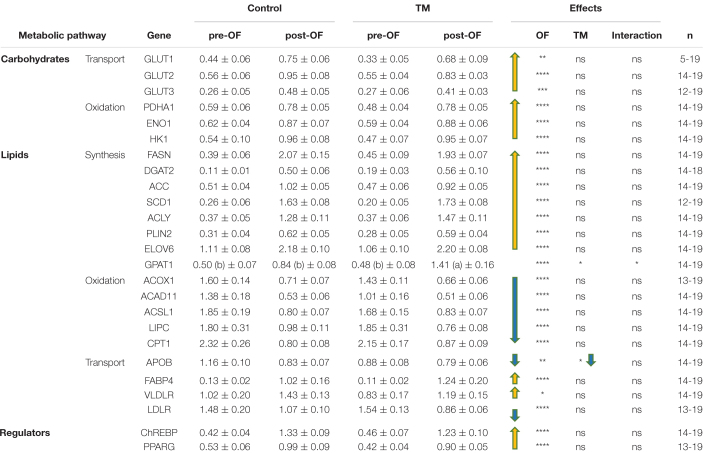
TABLE 1.
Hepatic relative expression of genes involved in the lipid and carbohydrate pathways depending on incubation conditions before and after overfeeding.

|
Data are presented as mean +/− SEM. TM, thermal manipulation; pre-OF, before overfeeding period; post-OF, after overfeeding period. ns, non significant, *P < 0.05, **P < 0.01, ***P < 0.001, ****P < 0.0001. Different letters in parentheses indicate significant differences measured between each group when there is an interaction between the OF and TM factors. n, number of samples.
