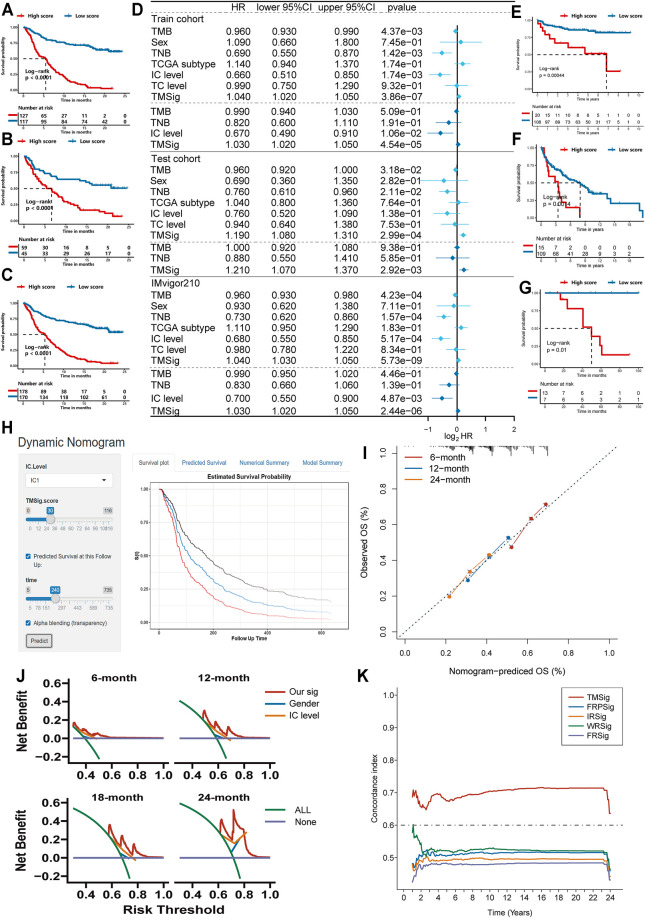
FIGURE 3.
Exploring the clinical practice value of TMSig. (A) Kaplan-Meier curves for overall survival (OS) of patients from the train cohort. (B) Kaplan-Meier curves for OS of patients from the test cohort. (C) Kaplan-Meier curves for OS of patients from the IMvigor210 cohort. (D) Independent prognostic analysis of TMSig. (E) Kaplan-Meier curves for OS of patients from the GSE32548 cohort. (F) Kaplan-Meier curves for OS of patients from the GSE48075 cohort. (G) Kaplan-Meier curves for OS of patients from the UTUC cohort. (H) Dynamic nomogram for clinical practice. (I) Calibration curve analysis. (J) The decision curves analysis. (K) The c-index of TMSig compared with other signatures.

