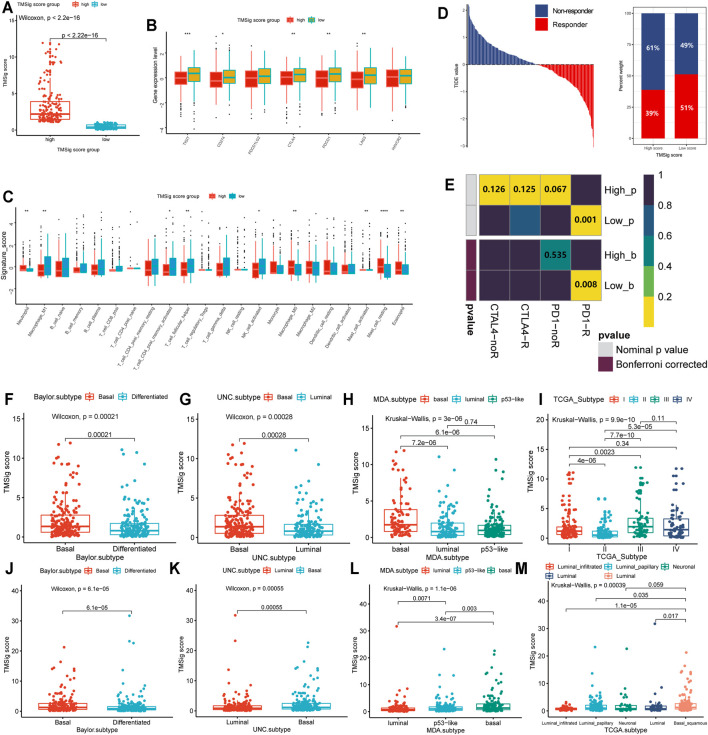
FIGURE 5.
Molecular differences between high- and low-score subgroups and distribution among previous subtypes. (A) The TMSig score in the high score group was significantly higher than that in the low score group. (B) The expression level of immune checkpoints in the high score and low score groups. (C) Immune infiltration cells are expressed in the high score and low score groups (*p < 0.05, **p < 0.01, ***p < 0.001, ****p < 0.0001). (D) The immune therapy response and TIDE value of patients with urothelial cancer. (E) The subclass mapping analysis showed a significant difference in response to anti-PD-1 therapy among these two groups. The distribution of TMSig score of the IMvigor210 cohort in molecular subtypes. (F) Baylor subtype, (G) UNC subtype, (H) MDA subtype, (I) TCGA subtypes. The distribution of TMSig score of the TCGA cohort in molecular subtypes. (J) Baylor subtype, (K) UNC subtype, (L) MDA subtype, (M) TCGA subtypes.

