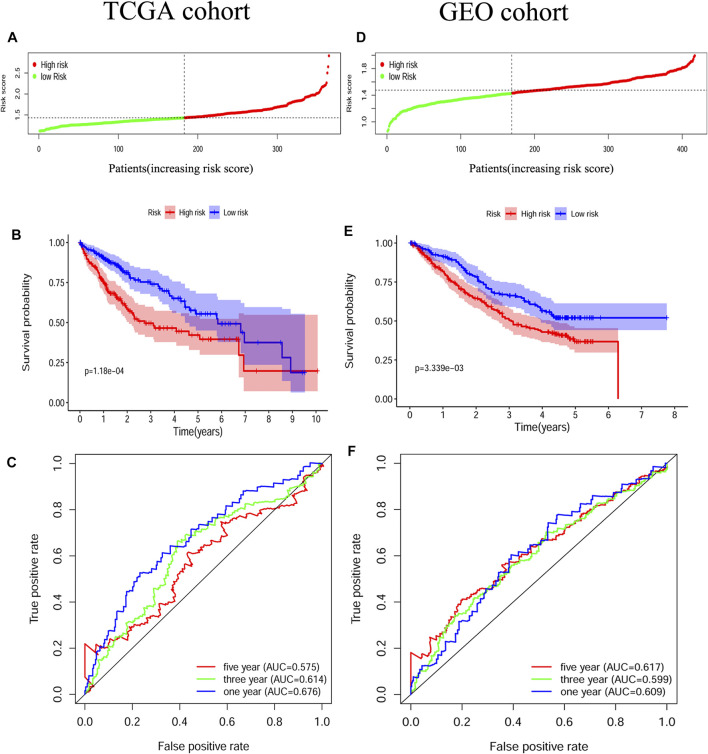
FIGURE 4.
Construction and validation of the pyroptosis-related gene signature (A) Patients divided by the median risk score in the TCGA cohort (B) Survival analysis between the high-risk and low-risk groups in the TCGA cohort (C) ROC curves indicated the accuracy of the prognostic model in the TCGA cohort (D) Patients divided by the median risk score in the GEO cohort (E) Survival analysis between the high-risk and low-risk groups in the GEO cohort (F) ROC curves indicated the accuracy of the prognostic model in the GEO cohort.

