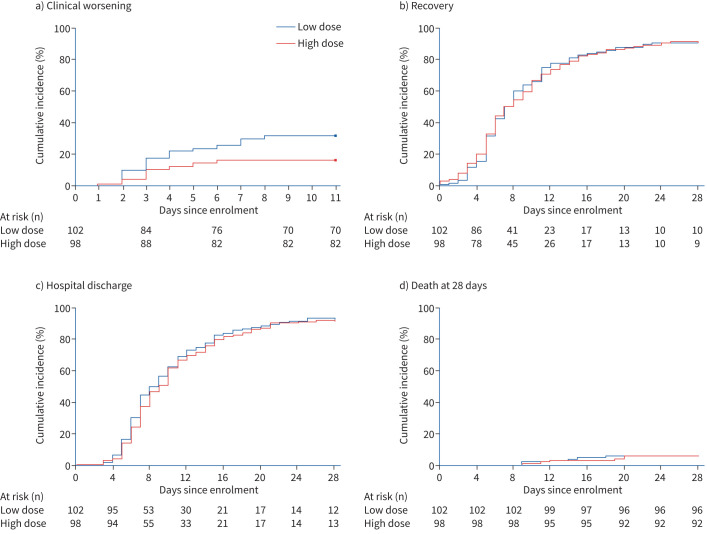
FIGURE 2.
Kaplan–Meier analysis of efficacy outcomes: Kaplan–Meier curves for the time-to-event analyses of a) clinical worsening (primary outcome); b) recovery, defined as the first day after enrolment on which a patient attained category 1, 2 or 3 on the seven-point ordinal scale (scores range from 1 to 7, with higher scores indicating worse clinical condition); c) hospital discharge; d) death.

