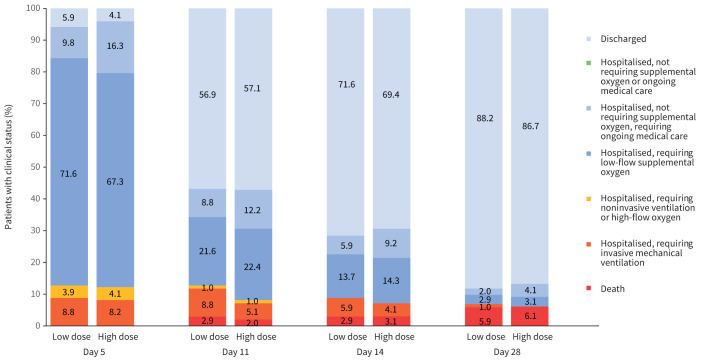
FIGURE 3.
Clinical status on a seven-point ordinal scale on study days 5, 11, 14 and 28 by treatment group. All percentage values in each point category are provided in supplementary table S3. At day 5, p=0.885 for comparison of the distribution of the high-dose group versus low-dose group. At day 11, p=0.666 for comparison of the distribution of the high-dose group versus low-dose group. At day 14, p=0.870 for comparison of the distribution of the high-dose group versus low-dose group. At day 28, p=0.831 for comparison of the distribution of the high-dose group versus low-dose group.

