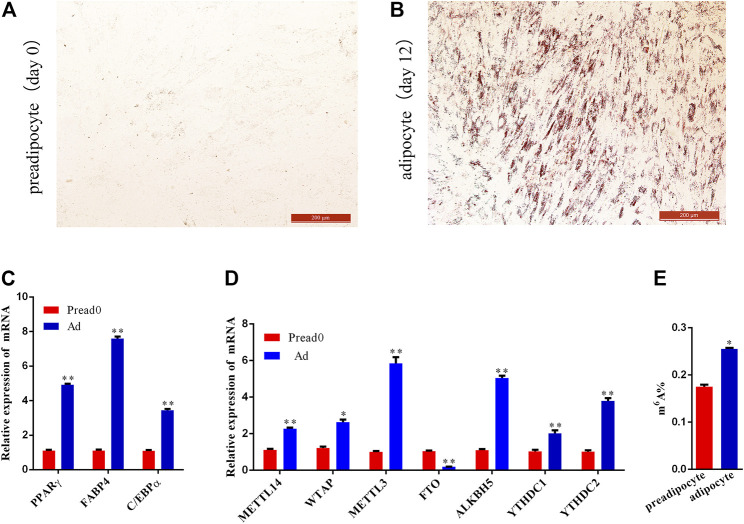
FIGURE 1.
Preadipocyte-induced differentiation and detection of m6A level between preadipocyte and adipocyte. (A,B) Preadipocytes and adipocytes dyed with Oil red O. (C) Relative expression of PPARγ, C/EBPα, and FABP4 between preadipocyte (day 0) and adipocyte (day 12). (D) The mRNA expression level of methyltransferases (METTL14, WTAP, and METTL3), demethylases (FTO and ALKBH5) and m6A-binding proteins (YTHDC1and YTHDC2). (E) m6A abundance between the preadipocytes and adipocytes. (SEM, * p < 0.05;** p < 0.01).

