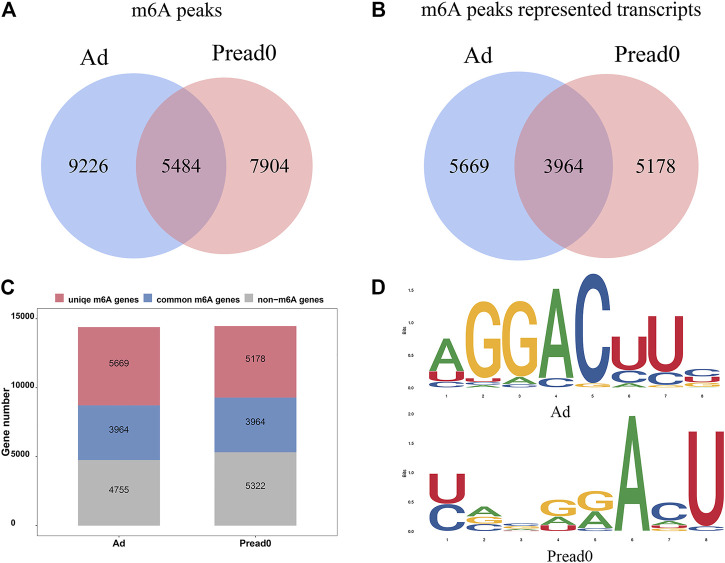
FIGURE 2.
m6A-seq transcriptome-wide and m6A peak analysis. (A) Number of common and specific m6A peaks in groups of preadipocyte and adipocyte. (B) Venn diagram showing the m6A peaks for transcripts of two group. (C) Profile of m6A-modified genes discovered in m6A-seq. (D) The motifs enriched from m6A peaks identified from the groups of adipocyte and preadipocyte.

