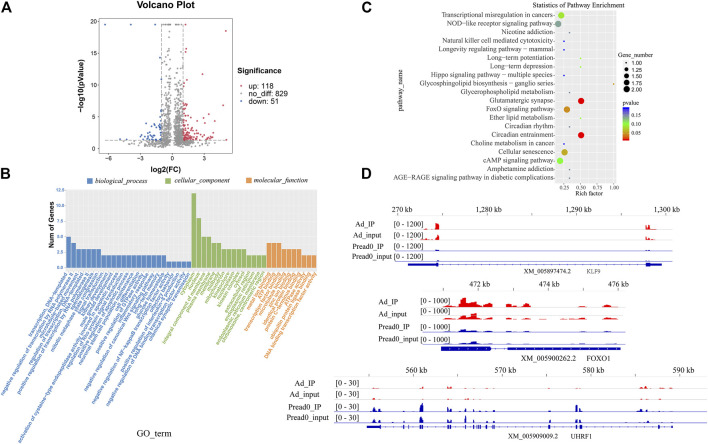
FIGURE 4.
The alteration of global m6A modification in adipocyte compared with preadipocyte. (A) Volcano plots showing different m6A peaks (fold change ≥2 and p < 0.05) between preadipocyte and adipocyte. (B) GO terms of genes with differential m6A peaks between preadipocyte and adipocyte. (C) The top 20 markedly enriched pathways for the genes of differential peaks between preadipocyte and adipocyte. (D) The abundance of m6A on KLF9, FOXO1, and UHRF1mRNA transcripts observed by m6A-seq in preadipocyte and adipocyte. Blue boxes represent exons; blue lines represent introns.

