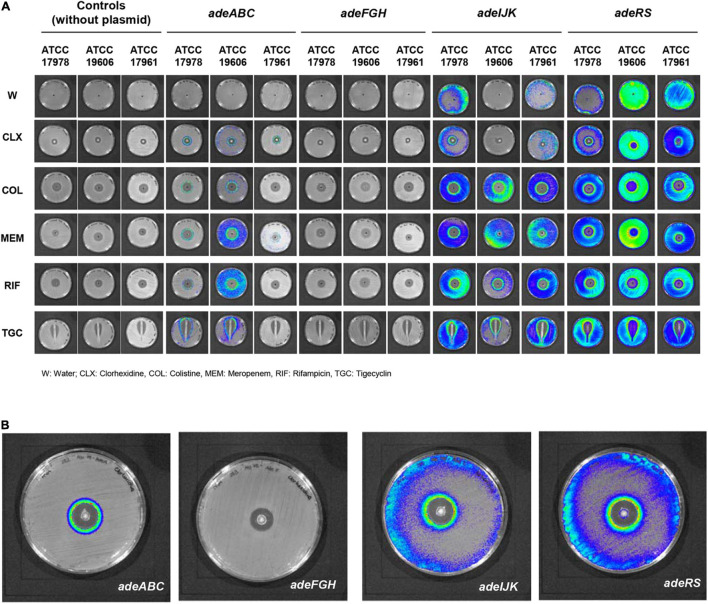
FIGURE 1.
Qualitative analysis of promoter activity in the 12 plasmid constructions. (A) Bioluminescence emission of the different constructions when subjected to a concentration gradient of different compounds for all promoters. (B) Magnification of chlorhexidine treatments in strain ATCC17978 for adeABC, adeFGH, adeIJK, adeRS (from left to right). Luminescence intensity is represented by color from greatest to least as follows: red, yellow, green and blue.

