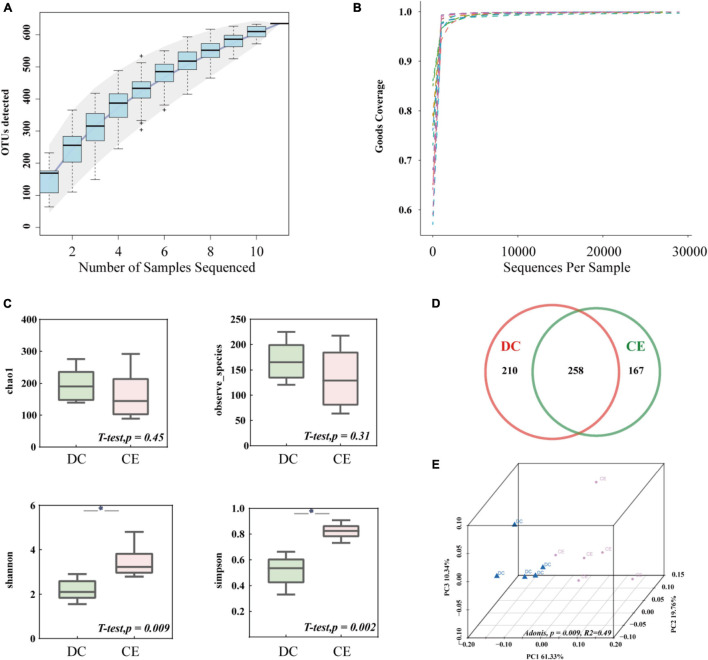
FIGURE 2.
The microbial community structure in the ileum was significantly altered by adding CE (n = 6 hens/group). (A) Species accumulation curve is used to estimate the rationality of sequencing sample quantity. (B) Alpha diversity Rarefaction curve based on Good’s Coverage value, which reflects the rationale of sequencing depth. (C) Alpha-diversity evaluation of ileum microbial richness and evenness by measuring chao1, observe-species, Shannon, and Simpson’s diversity indexes. (D) Venn diagram is used to represent the amount of shared and unique OTUs numbers. (E) Principal coordinate analysis (PCoA) is used to determine the similarities of microbial communities between different groups. *P < 0.05 compared to two groups.

